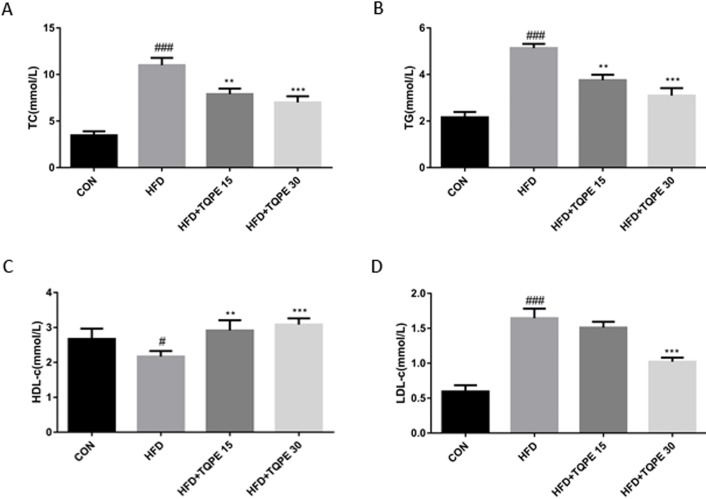
Figure 3. Effects of TQPE in HFD-induced NAFLD on plasma total cholesterol (TC) (A), triglycerides (TG) (B), high-density lipoprotein cholesterol (HDL) (C), and low-density lipoprotein cholesterol (LDL) (D) were measured.
All the results were presented as mean ± SE (n = 10). #P < 0.05, ###P < 0.001 vs. the CON group; **P < 0.01, ***P < 0.001 vs. the HFD group.

