
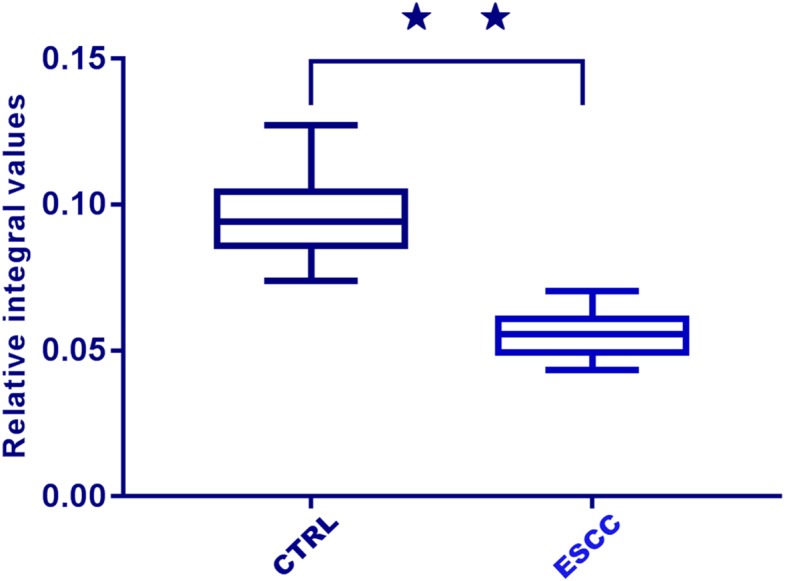
Figure 6. Box plots of relative integral values of dihydrothymine between healthy controls (CTRL) and ESCC groups (⋆⋆, p < 0.01).
Official websites use .gov
A
.gov website belongs to an official
government organization in the United States.
Secure .gov websites use HTTPS
A lock (
) or https:// means you've safely
connected to the .gov website. Share sensitive
information only on official, secure websites.