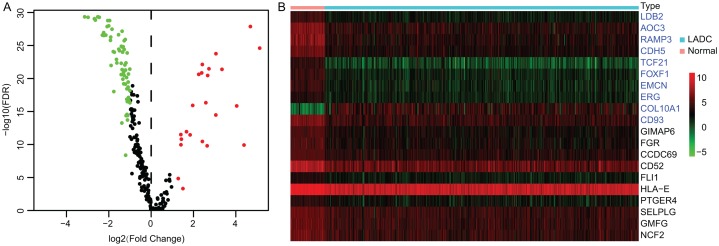
Figure 1. Identification of TME-related DEGs.
(A) Volcano plot of TME-related DEGs. |log2(Fold Change)| > 1 and FDR < 0.05 were set as screening criteria. The green, red and black dots represented the down-, up-regulated TME-related DEGs and genes that were not satisfied the screening criteria, respectively. (B) The heatmap of top 10 stromal and immune signature DEGs. The stromal signature DEGs were presented in blue color and immune signature DEGs were in black. TME, Tumor microenvironment; DEGs, Differentially expressed genes; LADC, Lung adenocarcinoma.

