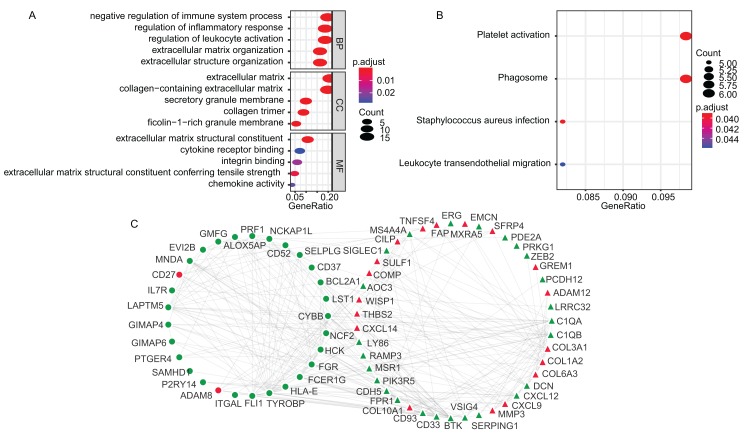
Figure 2. The GO, KEGG and PPI analysis of TME-related DEGs.
(A) The GO analysis of TME-related DEGs. (B) The KEGG pathway analysis of TME-related DEGs. (C) The PPI analysis of TME-related DEGs. In the PPI network, red and green represented up- and down-regulation; circle and triangle represented immune and stromal signature DEGs, respectively. BP, Biological Process; CC, Cellular Component; MF, Molecular Function; GO, Gene Ontology; KEGG, Kyoto Encyclopedia of Genes and Genomes; PPI, Protein–Protein Interaction; DEGs, Differentially expressed genes.

