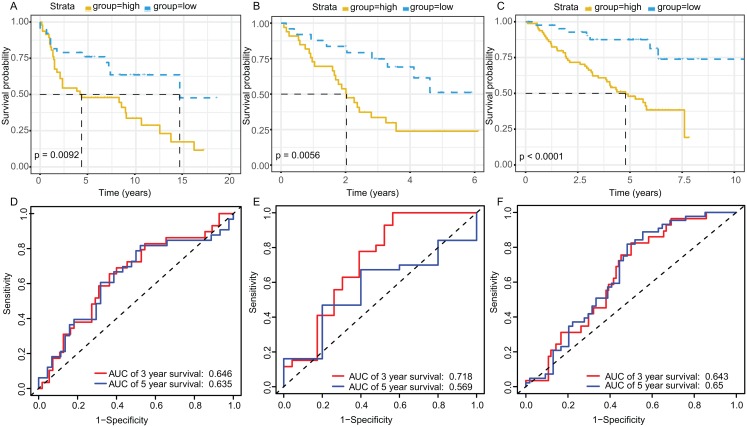
Figure 5. Survival and ROC curves for the three-gene signature in three GEO testing datasets.
Kaplan–Meier survival curves showing overall survival outcomes of GSE30219 (A), GSE3141 (B) and GSE50081 (C) according to relative high-risk and low-risk patients. The ROC analysis of GSE30219 (D), GSE3141 (E) and GSE50081 (F) for survival prediction by the three-gene signature. ROC, Receiver operating characteristic; AUC, Area under curve.

