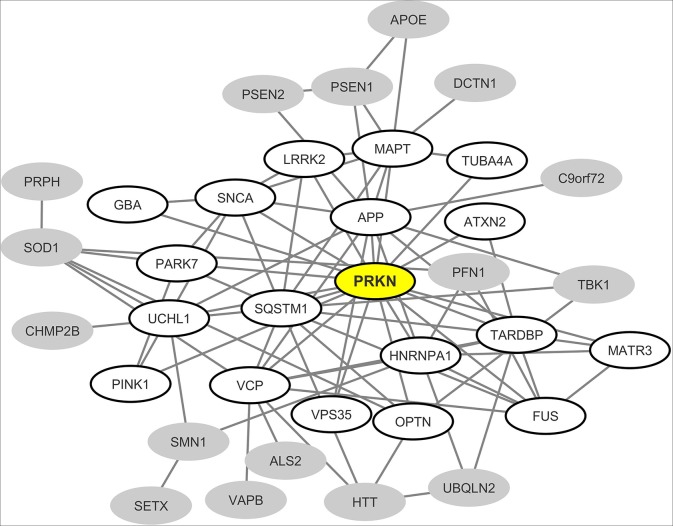
Figure 2.
Mapping of the protein-protein interaction network linking common neurodegeneration-associated proteins irrespective of the cell type considered. A survey of the human proteome was performed by querying the protein-protein interaction database BioGRID (38). Each node represents a protein indicated by the corresponding gene symbol and each edge represents an experimentally-demonstrated protein-protein interaction. In this network, the “PRKN” (Parkin) node, highlighted in yellow, exhibits the highest degree (i.e., the highest number of direct interactors). White nodes correspond to the first-shell partners of PRKN. Gray nodes are not direct interactors of PRKN.

