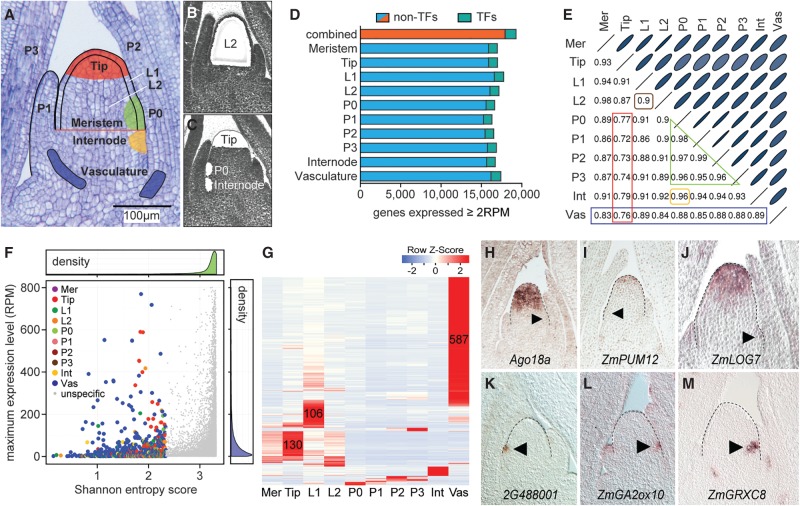
Figure 1.
Tissue-specific genes contributing to cell identity. (A) Longitudinal section of a 14-d-old B73 seedling apex. The 10 domains/tissues captured are illustrated. (B,C) Sections after laser microdissection of the L2 (B), or Tip, P0, and internode (C). (D) The number of genes expressed ≥2 RPM varies only slightly across tissues. (E) Correlation analysis identifies the Tip as the most distinctive cell type (red), followed by the vasculature (blue). Overall expression in the two clonal layers is highly correlated (brown). Expression profiles of leaf primordia of successive plastochron (P) stages are also highly correlated (green), and closely match expression in the internode (yellow). Ellipse sizes inversely match correlation scores. (Mer) Meristem, (Int) internode, (Vas) vasculature. (F) Density plots show that most genes have high SE scores and low expression values. Genes with SE score <2.33 (colored) show tissue-specific expression. For visual simplification, only genes with expression values ≤ 800 RPM are shown. (G) Heat map of cell-type–specific genes shows most mark the vasculature, Tip, or L1. Primordium stage-specific transcripts were also identified. (H–M) In situ hybridization verifying specificity for select Tip- (H–J) and P0-specific genes (K–M). Meristem shape is outlined. Arrowheads, P0.

