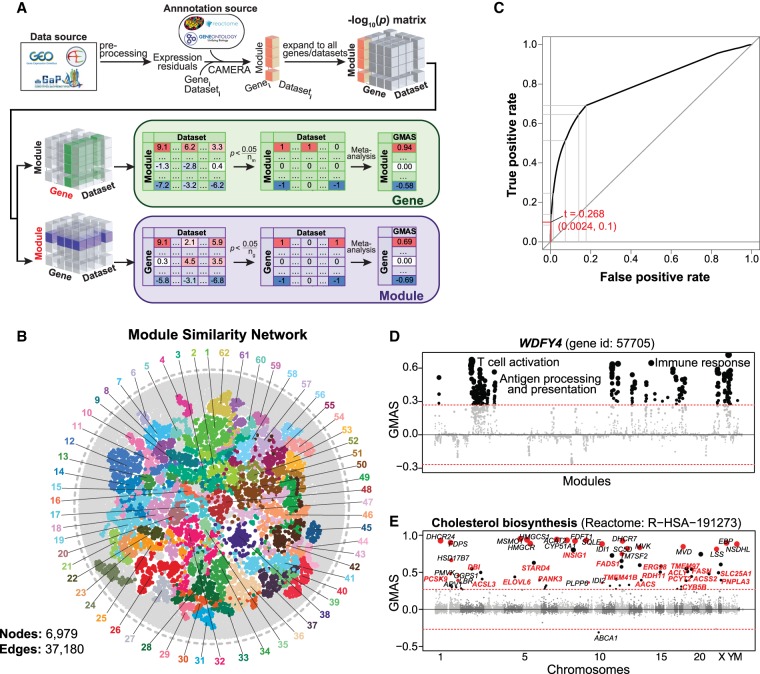
Figure 1.
Gene-Module Association Determination (G-MAD). (A) G-MAD methodology. See text and Methods for detailed description. (B) Module similarity network showing the composition similarities across all module pairs. Modules were detected using a community detection algorithm embedded in Gephi and indicated in different colors. The 10 most frequent words of the module terms in each module were used to represent the module and can be found in Supplemental Table S2. (C) Influence of the GMAS threshold (t) on the true positive rate (TPR) and false positive rate (FPR) of G-MAD. Using a threshold of 0.268, G-MAD identified 10% of true positives and 0.24% of false positives (reflected by the red lines intersecting the x- and y-axes). (D) G-MAD revealed the potential role of WDFY4 in T cell activation and immune response. The threshold of significant gene-module association is indicated by the red dashed line. Modules are organized by the module similarities. Known modules connected to WDFY4 from annotations are shown in red dots (there is no known connected module for WDFY4) and other modules with GMAS over the threshold are shown in black dots. Dot sizes reflect the GMAS of WDFY4 against the respective modules. Detailed information of all the modules is available at www.systems-genetics.org/modules_by_gene/WDFY4?organism=human. (E) G-MAD identified the involvement of known as well as 20 novel genes in cholesterol biosynthesis. The threshold of significant gene-module association is indicated by the red dashed line. Genes are organized by the genetic positions across chromosomes. Genes annotated to be involved in cholesterol biosynthesis are shown in red dots and novel genes with GMAS over the threshold are shown in black dots. Novel genes conserved in human, mouse, and rat are highlighted in red bold text.

