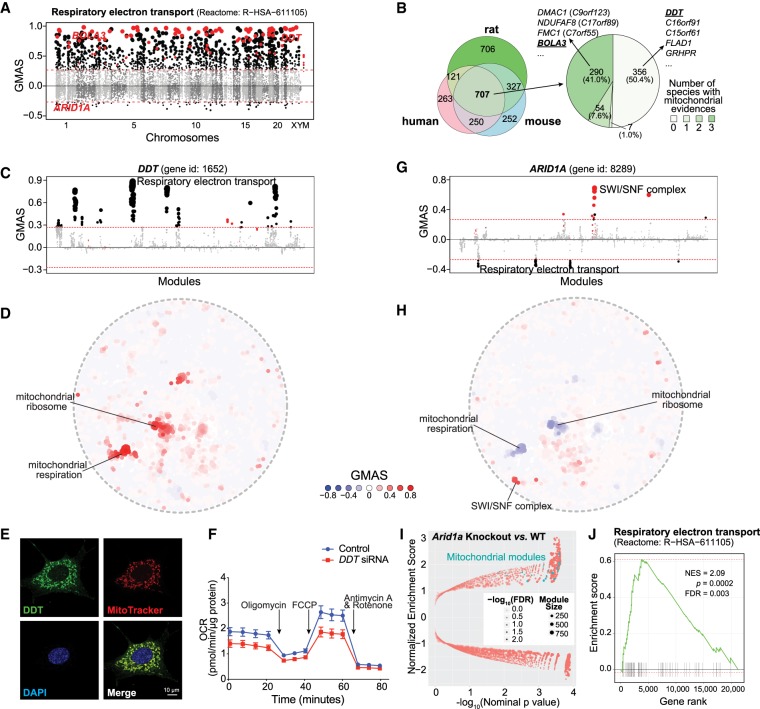
Figure 4.
G-MAD predicts novel genes linked to mitochondria. (A) G-MAD Manhattan plot of the respiratory electron transport (Reactome: R-HSA-611105) module in human. Genes are arranged based on their genetic positions and genes annotated to be involved in the module are colored red. Genes with absolute GMAS over 0.268 are considered significantly associated. DDT, BOLA3, and ARID1A are labeled. (B) Venn diagram of novel genes associated with respiratory electron transport module in human, mouse, and rat; 707 genes were predicted to be mito-proteins by G-MAD in all three species, and 351 genes, including DMAC1, NDUFAF8, FMC1, and BOLA3, were recently annotated to be involved in mitochondrial respiration in at least one species, whereas 356 genes, including DDT, C16orf91, C15orf61, FLAD1, and GRHPR, have not been previously linked with mitochondria based on the current annotations. The association results for all genes in human, mouse, and rat can be found in Supplemental Table S5. (C) DDT associates with mitochondrial respiratory chain modules in human. The threshold of significant gene-module association is indicated by the red dashed line. Modules are organized by module similarities. Known modules connected to DDT from annotations are highlighted in red and other modules with GMAS over the threshold are colored in black. Dot sizes reflect the GMAS of DDT against the respective modules. (D) Module similarity network showing the modules associated with DDT. Modules are plotted based on their layout in Figure 1B and colored based on their GMAS against DDT. (E) Mitochondrial localization of DDT in mouse embryonic fibroblasts (MEFs). DDT expression is overlapped with the Mitotracker red label. (F) DDT knockdown leads to the reduction of oxygen consumption rate (OCR) as a reflection of mitochondrial respiration in human HEK293 cells. Addition of specific mitochondrial inhibitors, including the oligomycin (ATPase inhibitor), FCCP (uncoupling agent), and rotenone/antimycin A (electron transport chain inhibitors), are indicated by arrows. (G) ARID1A negatively associates with the mitochondrial respiratory chain in human. The threshold of significant gene-module association is indicated by the red dashed line. Modules are organized by the module similarities. Known modules connected to ARID1A from extant annotations are highlighted in red and other modules with GMAS over the threshold are colored in black. Dot sizes are proportional to GMAS of the respective modules. (H) Module similarity network showing the modules associated with ARID1A. Modules are colored based on their GMAS against ARID1A. (I) Mice with the uterine-specific Arid1a knockout showed positive enrichment in mitochondrial respiration modules. Nominal P-values from the GSEA results are used to plot against normalized enrichment score (NESs), with dot sizes indicating the number of genes in the modules and transparencies indicating the false discovery rate (FDR). (J) Enrichment plot showing the enrichment of genes included in respiratory electron transport in uterus-specific Arid1a knockout mice compared to wild-type controls. Genes are ranked based on the fold change between Arid1a knockout and wild-type mice, and the ranking positions of genes in respiratory electron transport are labeled as vertical black bars. (NES) Normalized enrichment score.

