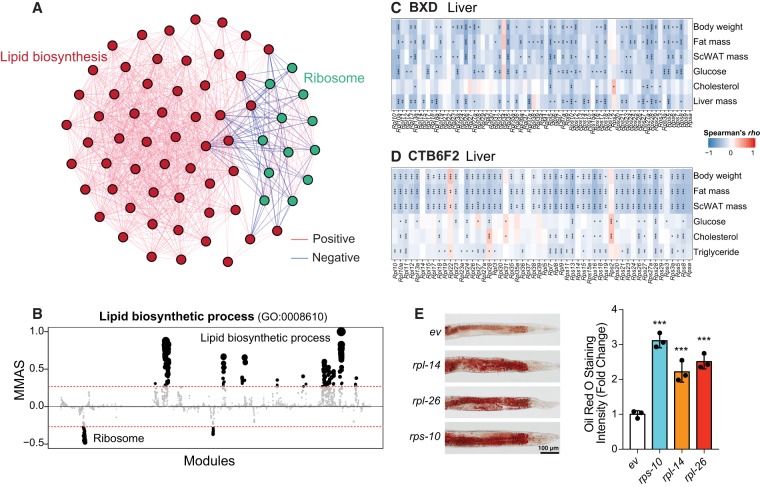
Figure 6.
M-MAD reveals a negative association between the ribosome and lipid biosynthetic modules. (A) Subnetwork for the ribosome and lipid biosynthetic modules. The colors of the edges indicate the significance of module connections, with red as positive and blue as negative. (B) Lipid biosynthetic process negatively connected with ribosomal modules in human. The threshold of significant module-module connection is indicated by the red dashed line. Modules are organized by the module similarities. Dot sizes are proportional to MMASs of the respective modules. (C,D) Transcripts of genes encoding for ribosomal proteins in the liver negatively correlate with metabolic traits, such as body weight, fat mass, plasma glucose and cholesterol levels, in the BXD (C) and CTB6F2 (D) mouse cohorts. (*) P < 0.05, (**) P < 0.01, (***) P < 0.001. (E) Feeding adult C. elegans with RNAi clones of ribosomal proteins, including rps-10, rpl-14, and rpl-26, results in the accumulation of lipids, as reflected by Oil Red O staining. Experimental scheme and additional examples are shown in Supplemental Fig. S12. (***) P < 0.001. (ev) Empty vector. n = 3.

