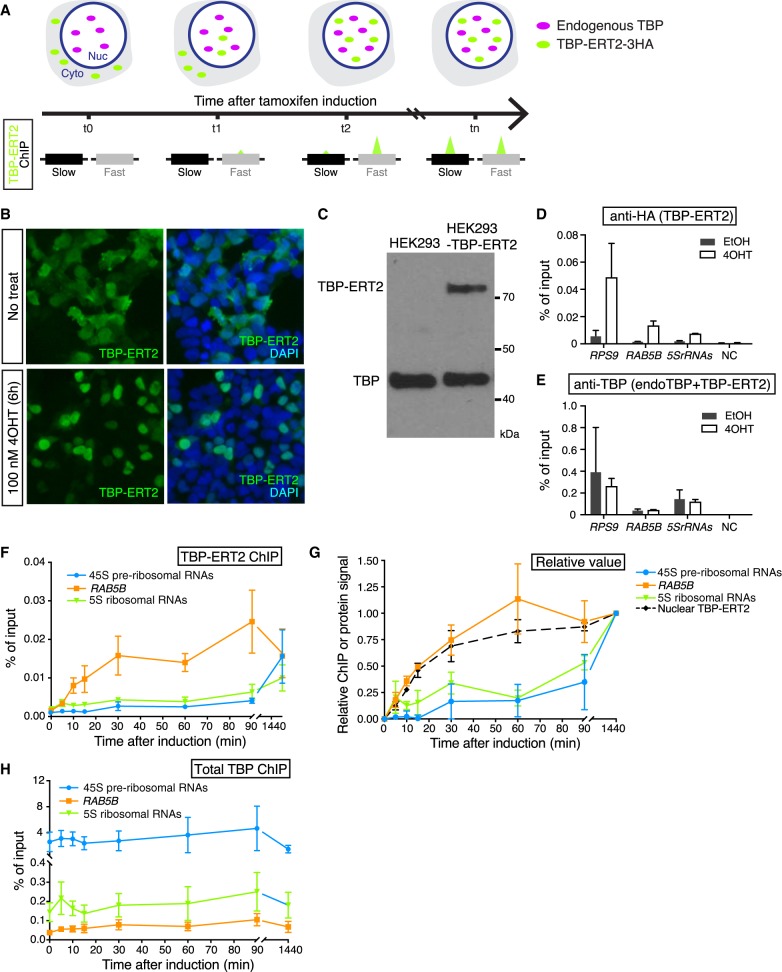
Figure 1.
Nuclear translocation of TBP-ERT2. (A) Schematic illustration of tamoxifen-inducible, time-course ChIP analysis. (B) Immunofluorescence image of TBP-ERT2 (green) and DAPI (blue) in HEK293 cells transiently transfected with TBP-ERT2-expressing vector that are treated or nontreated with 100 nM tamoxifen (4OHT) for 6 hr. (C) Western blot of whole-cell extracts from HEK293- and TBP-ERT2-expressing cells with antibody against endogenous TBP. (D,E) Binding at the indicated loci (x-axis) of TBP-ERT2 (D) and total TBP (endogenous TBP and TBP-ERT2) (E) in cells stably expressing TBP-ERT2. Error bars indicate SD (n = 3). (F) Binding of TBP-ERT2 at the indicated loci at the indicated times after tamoxifen addition. (G) Abundance of nuclear TBP-ERT2 (black dashed line) and binding relative to the value at 1440 min. Error bars indicate SD (n = 3). (H) Binding of total TBP at the indicated loci at the indicated times after tamoxifen addition.

