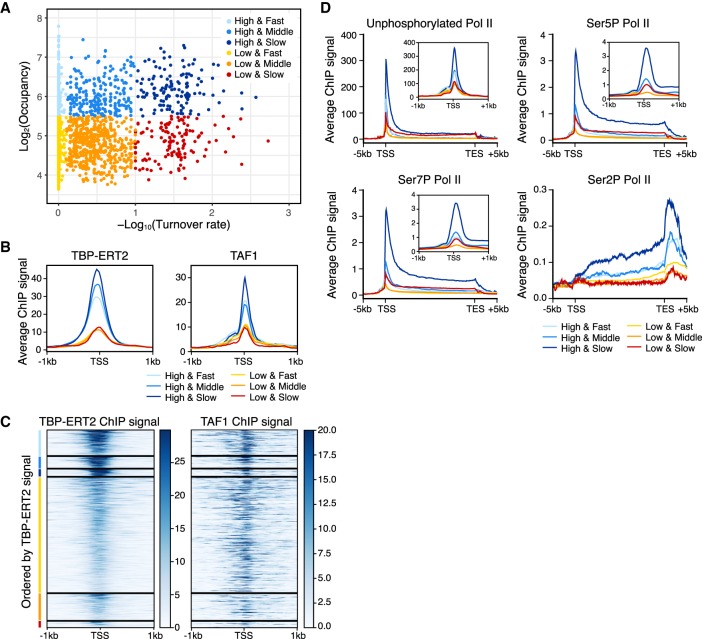
Figure 4.
Strong transcription activity of genes with promoters with slow TBP turnover. Colors indicate the groups categorized based on the binding turnover rates and occupancy (n = 3326; High and Fast n = 441, High and Middle n = 202, High and Slow n = 126, Low and Fast n = 1985, Low and Middle n = 462, Low and Slow n = 110). (A) Scatter plot of TBP-ERT2 peaks annotated as Pol II promoters in log2TBP-ERT2 occupancy versus −log10TBP-ERT2 binding turnover rate. (B) Means of TBP-ERT2 and TAF1 binding between −1 kb to +1 kb from the TSS in each group. (C) Heat map of TBP-ERT2 and TAF1 binding at each target site within the indicated groups. (D) Means of unphosphorylated or phosphorylated Pol II binding (Fong et al. 2017) between the TSS and transcription end sites (TES) plus 5 kb upstream or downstream in each group. Plots in the insets are means of Pol II ChIP-seq signal along −1 kb to +1 kb from TSS in each group.

