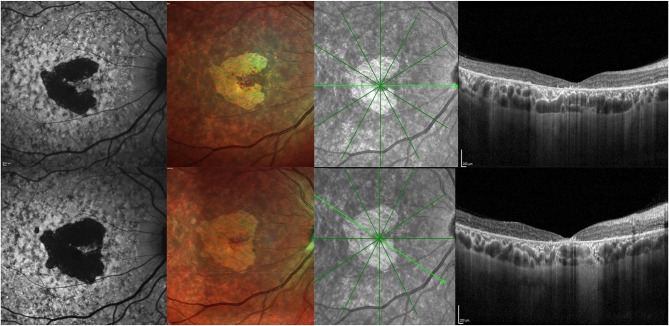
Figure 3.
Progression of STGD1. First row: Short wavelength autofluorescence, Multicolor imaging, and OCT at baseline. Second row: Short wavelength autofluorescence, Multicolor imaging, and OCT after 12 months, showing enlargement of the area of RPE and photoreceptor loss on autofluorescence and central retinal thinning the foveal area.

