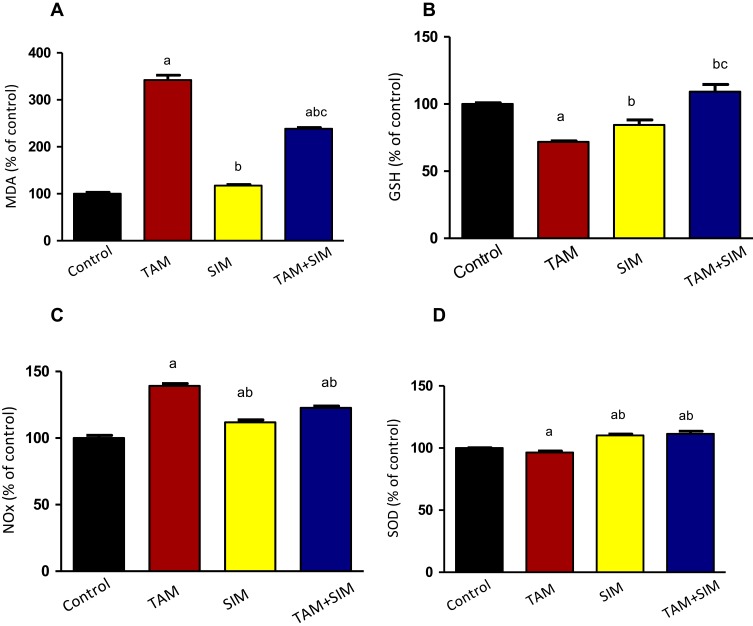
Figure 9.
Effect of TAM, SIM, and their combinations on oxidative stress markers of solid EAC of mice. MDA (A), GSH (B), SOD (C), and NOx (D). Results are expressed as means±SD of tumor volume from six mice. Statistical significance of the result was analyzed by one-way ANOVA followed by Tukey multiple comparison test. (a) Significantly different from the control group, (b) significantly different from the TAM group, and (c) significantly different from SIM, at P˂0.05.

