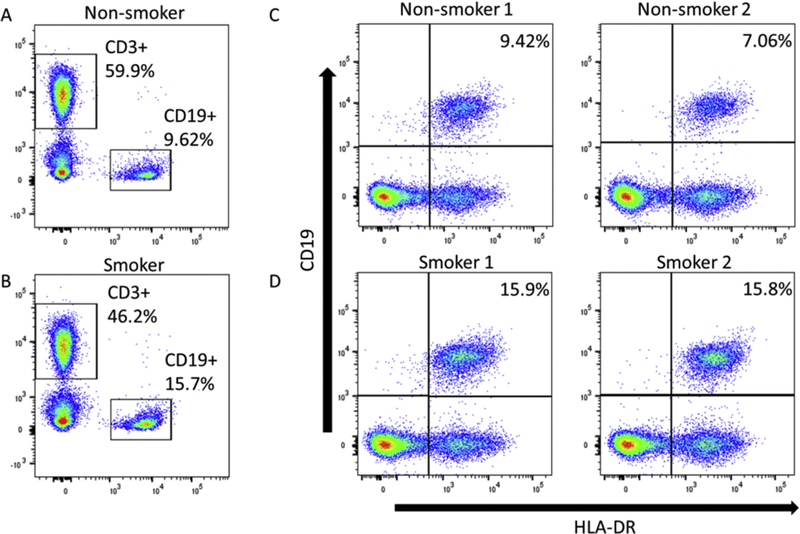
Fig 3.

Analysis of B cells and activated B cells by flow cytometry. Top panels are non-smokers and bottom panels are smokers. T (CD3+) and B (CD19+) cell populations were identified for non-smokers (A) and smokers (B), and the CD19+ cells were analyzed for activated B cells (CD19+ HLA-DR+) in two non-smokers (C) and two smokers (D).
