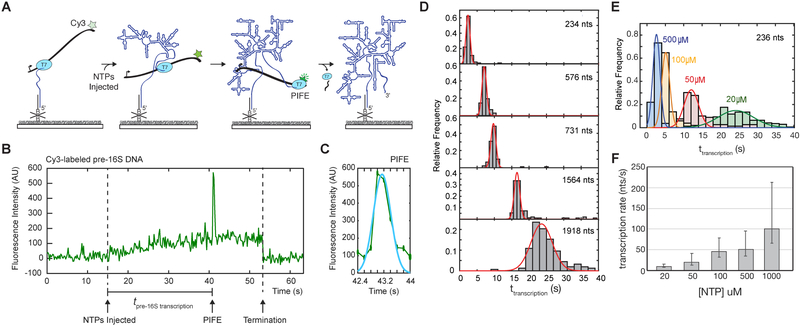
Figure 2.
PIFE signature for transcription speed. A) Single molecule fluorescence signature reports the time of RNA synthesis by immobilized TECs. Transcription pulls the Cy3-labeled DNA template toward the slide during transcription, causing an increase in Cy3 fluorescence as it moves into the TIR field. When T7 RNAP reaches the Cy3 dye in the DNA template, PIFE causes a brief increase in Cy3 intensity followed by a loss of Cy3 signal indicating termination and release of the DNA template or photobleaching. B) Representative single-molecule trajectory showing the fluorescent transcription signature and measurement of transcription time. Transcription restart is marked by NTP injection (defined in Methods and Supplemental Figure S2A and S2B) and end of pre-16S RNA transcription is indicated by PIFE. C) Single PIFE peaks are fit to a Gaussian function to define the peak center which is taken to be the RNA transcription end point. D) Histograms of transcription times for DNA templates generating RNAs of different lengths as indicated. Number of molecules for each histogram: N(234 nts) = 82; N(576 nts) = 103; N(731 nts) = 91; N(1564 nts) = 110; N(1918 nts) = 119. E) Transcription time in different NTP concentrations for the 16S5WJ RNA (234 nts). Number of molecules in each histogram: N(500 μM) = 77; N(100 μM) = 51; N(50 μM) = 79; N(20 μM) = 121. F) Average transcription rate (± s.d.) from histograms in E.

