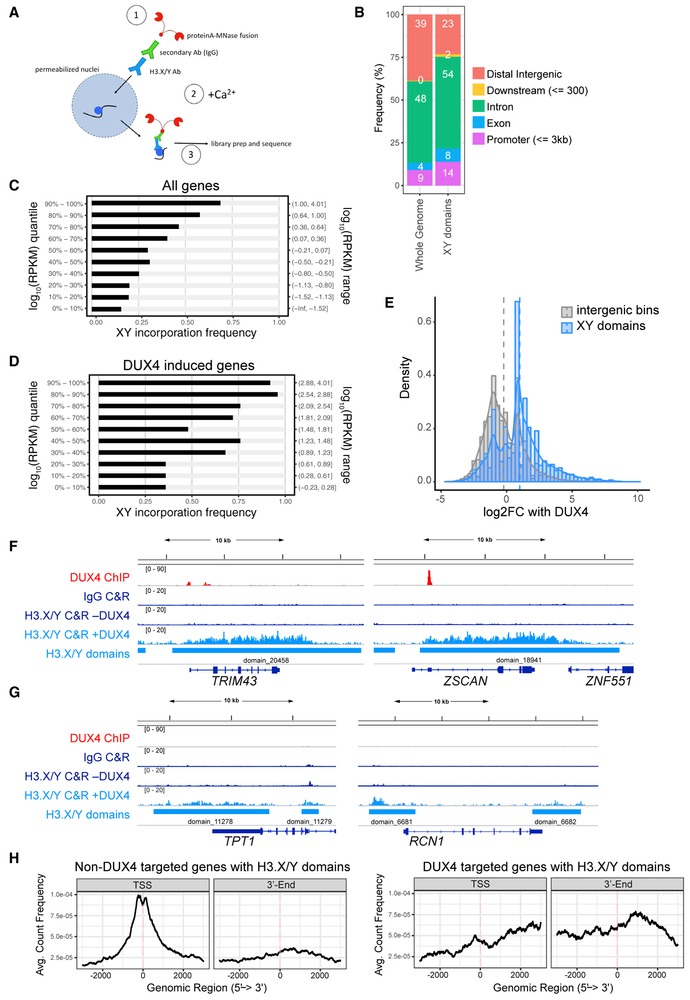
Figure 2. H3.X/Y Are Incorporated in Expressed Regions of the Genome.
(A) Schematic of CUT&RUN protocol. H3.X/Y nucleosome is represented by a blue circle. CUT&RUN has been used successfully with antibodies that do not perform well in standard chromatin immunoprecipitation (ChIP) assays (Liu et al., 2018), and we used it for this study because the antibody to H3.X/Y did not work for standard ChIP.
(B) Distribution of genomic annotations containing H3.X/Y domains.
(C) Bar graph depicting association of XY incorporation and all DUX4-induced genes (Jagannathan et al., 2016). Gene expression quantiles (log_10 RPKM quantile; y axis) are plotted against the percentage of genes in each quantile interval overlapping with H3.X/Y domains (x axis). Pearson correlation = 0.958.
(D) Same as (C) for robust DUX4 target genes (n = 251 with adjusted p < 0.05, corresponding to H_0: ∣lfc∣ < 4). Pearson correlation = 0.976.
(E) Histogram of intergenic region expression change with DUX4 induction. Comparing intergenic H3.X/Y domains with random intergenic bins of comparable size shows an association between H3.X/Y domains and DUX4-induced transcription. Vertical dashed lines mark mean log2 fold change with DUX4 for each group.
(F) DUX4 ChIP-seq (Geng et al., 2012), immunoglobulin G (IgG), or H3.X/Y CUT&RUN (C&R) and called H3.X/Y domains at DUX4 target genes TRIM43 and ZSCAN4.
(G) Same as (F) but for genes constitutively expressed (TPT and RCN1).
(H) Analysis of the distribution of H3.X/Y CUT&RUN reads within genes. Left panel shows highly expressed, non-DUX4 target genes with H3.X/Y domains (n = 679); right panel shows DUX4 target genes only (n = 191).
See also Figure S2.

