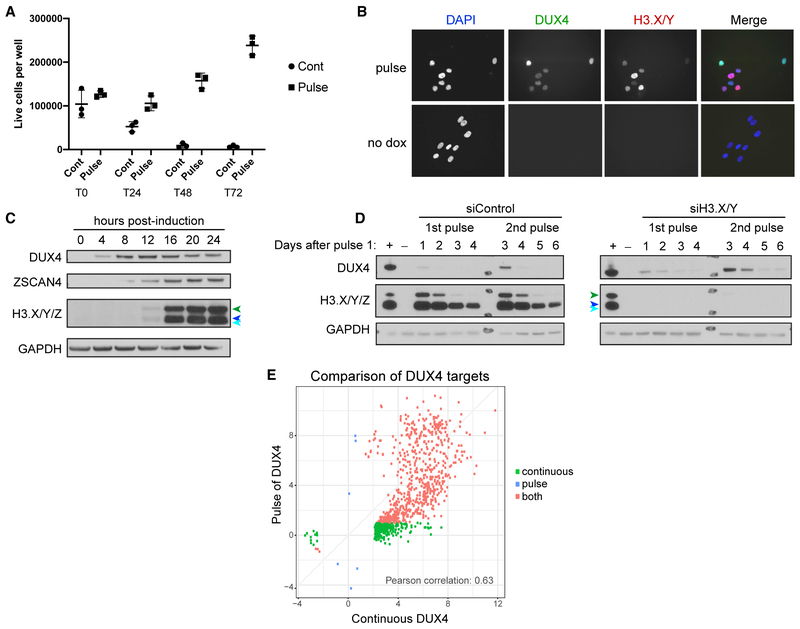
Figure 3. A Pulse of DUX4 Activates Target Gene Expression with Little Cell Toxicity.
(A) Counts of live MB135iDUX4 cells (cells that exclude trypan blue) before and at daily time points after continuous exposure to doxycycline (cont) or a 4-h pulse of doxycycline (pulse). T0, T24, T48, and T72 indicate the hours following initial doxycycline addition.
(B) DUX4 and H3.X/Y immunofluorescence in MB135iDUX4 cells 8 h after the start of a 4-h pulse of doxycycline (pulse) shows induction in nearly all cells, with no staining in uninduced (no dox) cells.
(C) Western blot analysis of MB135iDUX4 cells up to 24 h after DUX4 pulse. Cells were induced from 0 to 4 h. H3.X/Y/Z are identified with colored arrowheads: H3.Z (green); H3.X (dark blue); and H3.Y (light blue).
(D) MB135iDUX4 cells with control or H3.X/Y knockdown with 1 or 2 pulses of DUX4 on days 0 and 2, respectively, and harvested 1–4 days after each pulse (days 1–4 for 1st pulse; days 3–6 for 2nd pulse). +, continuous dox overnight; –, uninduced day 0 cells. H3.X/Y/Z are identified as in (C).
(E) Comparison of DUX4-induced genes from RNA-seq datasets in MB135iDUX4 cells after continuous (from Jagannathan et al., 2016) or pulsed DUX4 expression (log2-fold change over no DUX4 induction with adjusted p < 0.05). Axes show degree of gene induction (log2-fold change over no DUX4) with adjusted p < 0.05 corresponding to H_0: ∣log2-fold change∣ < 2. Green indicates genes activated less than 2-fold (log2-fold change < 1.0) in the pulse condition, red indicates genes induced more than 2-fold in the pulse, and blue indicates genes induced by the pulse but less than 2-fold in the continuous.

