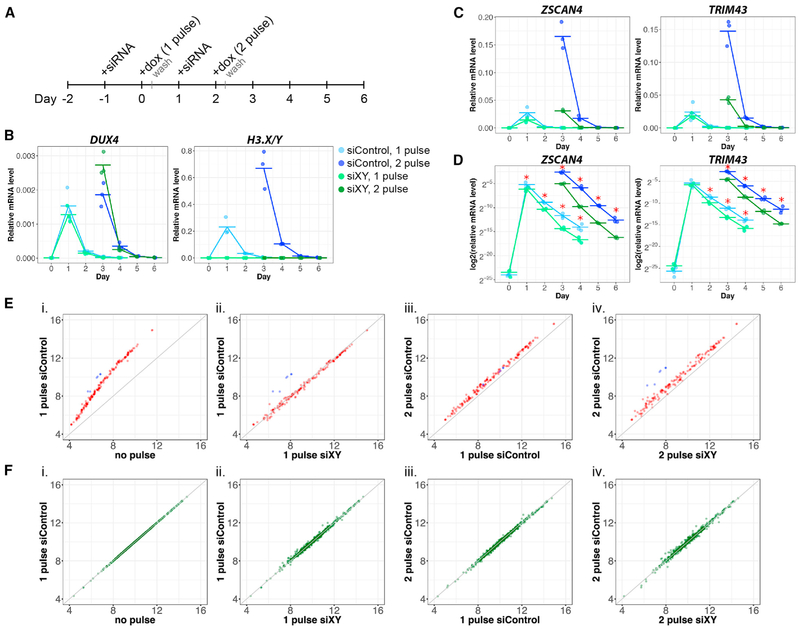
Figure 4. H3.X/Y Incorporation Increases the Perdurance and Re-expression of DUX4 Target Genes.
(A) Schematic of experimental design.
(B–D) qRT-PCR in MB135iDUX4 cells with 1 or 2 pulses of DUX4 and treatment with siH3.X/Y (green) or siControl (blue). Cells were harvested before induction and 1–4 days after each pulse, with 3 biological replicates for each sample shown, relative to RPL-27.
(D) Data from (C) plotted on a log scale illustrate differential perdurance of DUX4 target gene expression in siH3.X/Y relative to siControl samples (*p < 0.05; one-tailed Wilcoxon rank sum test). Based on a functional t test on the null distribution built by permutations (see STAR Methods), the difference of the slopes between siControl and siH3.XY is significant (p < 1e–12).
(E) Expression of DUX4 targets measured by RNA-seq in MB135iDUX4 cells, shown as average log2 normalized read counts of biological triplicates. Sequences in the H3.X/Y family targeted by siXY are shown in blue. Null model (no difference between conditions) is shown in gray. (1) Induction of DUX4 targets, (2) comparison of H3.X/Y and control knockdown with a single pulse, (3) super-induction of DUX4 targets with a second pulse in control knockdown samples, and (4) knockdown of H3.X/Y eliminating super-induction are shown.
(F) Expression of genes with H3.X/Y domains that are unaffected by DUX4, plotted as in (E).
See also Figures S2 and S4.

