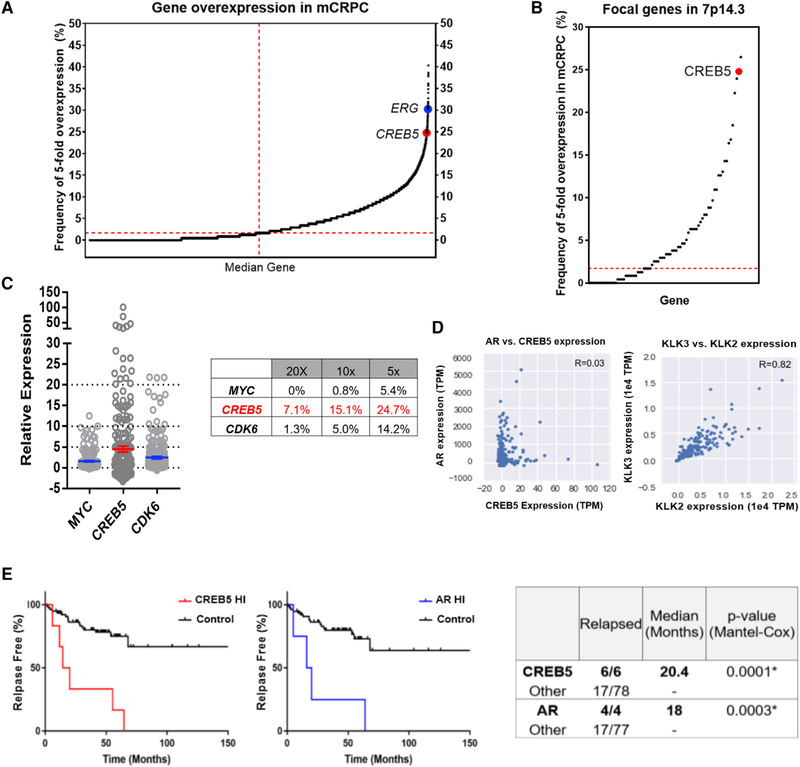
Figure 7. CREB5 Is Overexpressed in Prostate Cancer.
(A) Frequencies by which 14,876 genes were overexpressed 5-fold were determined in 238 mCRPC. The frequencies of overexpression for the median gene (1.7%, dotted red line), ERG (30.3%), and CREB5 (24.7%) are depicted.
(B) Frequency of 5-fold overexpression of CREB5 and 75 other genes in the 7p14.3 focal peak is depicted as open circles. CREB5 is highlighted (red circle).
(C) Expression levels of MYC, CREB5, and CDK6 in 238 mCRPC (TPM divided by median expression). The dotted lines represent 5-fold, 10-fold, and 20-fold expression. The table summarizes the percentage of tumors that express the genes at these respective levels.
(D) Relative expression of CREB5 and AR plotted (left) in TPM. Two well-correlated AR target genes, KLK2 and KLK3 (PSA), are shown on the right. Axes are labeled with TPM values.
(E) The relapse rate is plotted for prostate cancer tumors with amplified or overexpressed (Z score > 2) CREB5 (red) or AR (blue) relative to all other tumors.

