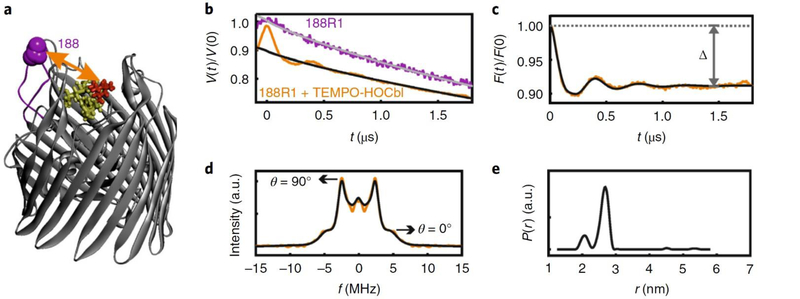
Figure 3 |. In-situ PELDOR in native OM.
(a) Position 188 in the second extracellular loop and the TEMPO-labeled hydroxycobalamin (TEMPO-HOCbl, 25 μM) are highlighted on the BtuB crystal structure (PDB 1NQH). The TEMPO-HOCbl was synthesized as described in Box 1. (b) Original PELDOR data obtained in native OM as indicated. The data are slightly shifted along the vertical axis for clarity. For the 188R1 mutant, the data perfectly fit into a stretched exponential decay (). (c) The dipolar evolution (in yellow) obtained for 188R1/TEMPO-HOCbl PELDOR after correction for the intermolecular contribution () and the corresponding fit from Tikhonov regularization (TR) is overlaid (in black). The modulation depth (Δ) is indicated. Overall, the data suggests a two-dimensional distribution of the spins over the large cell surface and deviation of the value for (from 2.0) might be for other reasons including the membrane curvature and sample inhomogeneity. (d) The dipolar spectrum obtained with Fourier transformation (in yellow) or TR (in black) of c. Frequencies corresponding to the parallel (θ = 0) and perpendicular (θ = 90) orientations of the interspin vectors to the B0 are indicated. (e) Interspin distance distributions obtained from TR of c.

