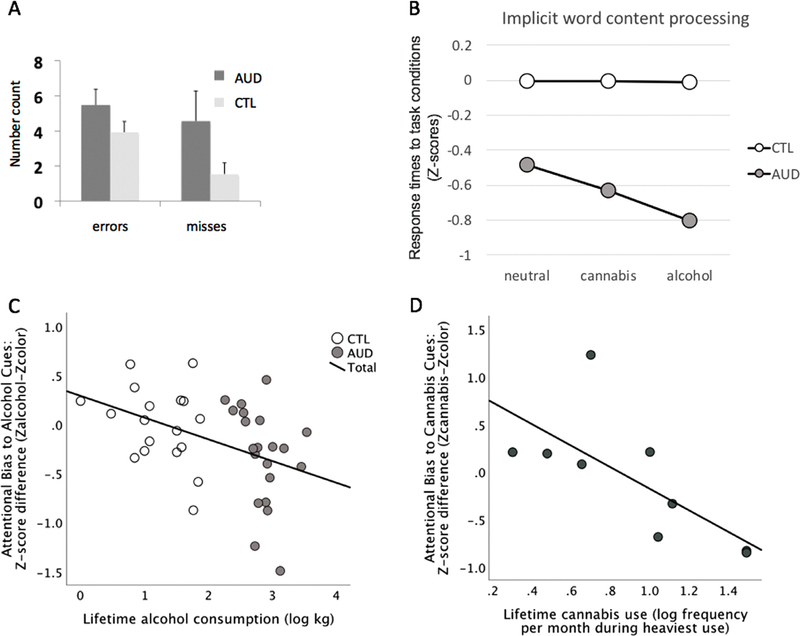
Fig. 2.
Addiction-Stroop color match-to-sample task performance.
A. Accuracy: Means and SD (standard deviations) for number of errors and misses. B. Color-matching performance for alcohol, cannabis, neutral (color) word task conditions: Education-corrected standardized Z-scores (of reaction times) depicting the deviation of AUD from the control group (CTL: mean Z = 0 ± 1 SD). C. Correlation graph depicting the relation between lifetime alcohol consumption and attentional bias to alcohol cues in AUD (using standardized education-corrected scores). D. Correlation graph depicting the relation between cannabis use frequency and attentional bias to cannabis cues in AUD-CUD (using standardized education- corrected scores). Abbreviations: AUD: alcohol use disorder, CUD: cannabis use disorder, CTL: healthy controls.

