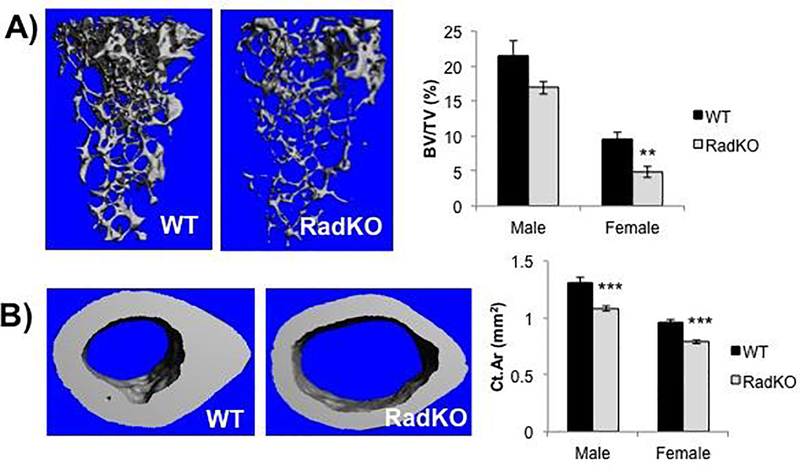
Figure 1. Lower trabecular and cortical bone volume in the femora of Rad−/− mice.
A) Representative images from μCT analysis of trabecular bone at the distal femora of WT and RadKO mice with accompanying quantification of the trabecular bone volume fraction (BV/TV). B) Representative images from μCT analysis of cortical bone at the midshaft of WT and RadKO mouse femora with corresponding quantification of the cortical bone area fraction (Ct.Ar/Tt.Ar). N=5–15 mice per group, 4 months of age. ** p<0.01, *** p<0.001 compared to WT by Student’s t test.

