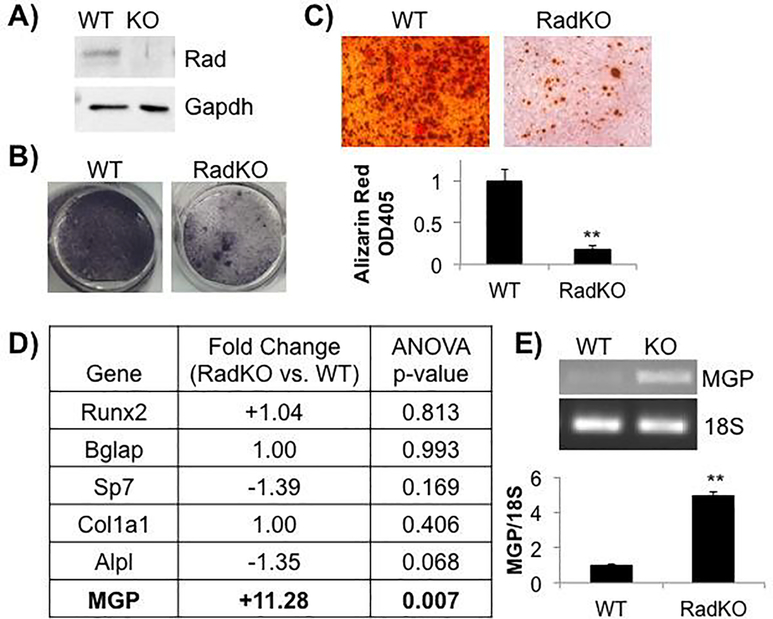
Figure 6. Less mineralization in Rad−/− osteoblasts in vitro.
A) Representative immunoblot of WT and RadKO calvarial osteoblast lysates confirms Rad expression in these cells. N=3 isolations per genotype. B) Representative images of WT and RadKO primary calvarial osteoblasts stained for alkaline phosphatase activity after 7 days in osteogenic media. N=3 isolations per genotype. C) Representative images of Alizarin Red S staining of WT and RadKO primary osteoblast monolayers after 28 days in osteogenic media. Staining was quantified by solubilization of the stain in acetic acid, neutralization, and optical density measurement at 405 nm. N=3–4 isolations per genotype. ** p<0.01 compared to WT by Student’s t test. D) Osteoblast marker gene expression from microarray analysis of WT and RadKO primary osteoblasts. N=2 isolations per genotype. E) RT-PCR analysis of MGP expression confirms microarray result. N=3 isolations per genotype.

