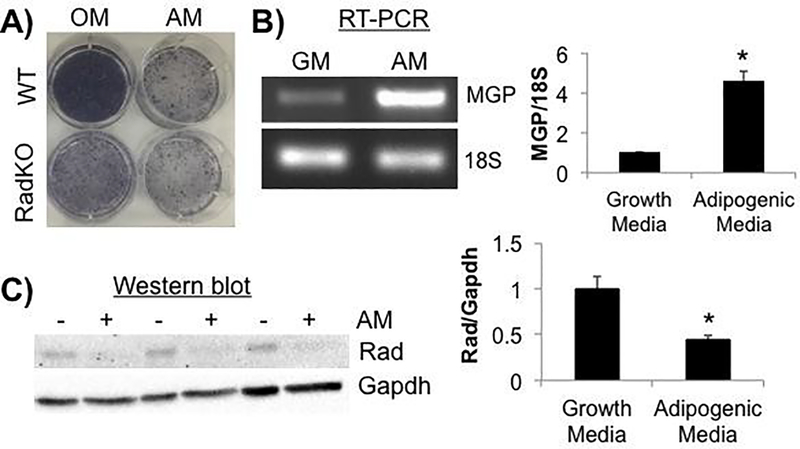
Figure 9. Adipogenic induction results in lower endogenous Rad levels.
A) Representative images of alkaline phosphatase activity in WT and RadKO primary osteoblast monolayers following 7 days in osteogenic (OM) or adipogenic (AM) media. N=3 isolations per genotype. B) RT-PCR analysis of MGP expression levels normalized to 18S RNA. RNA was isolated from WT primary osteoblasts after 3 days in growth (GM) or adipogenic (AM) media. N=3 isolations. C) Western blotting of WT osteoblast lysates after 7 days in growth (−) media or adipogenic (+) media. N=3 isolations. * p<0.05 by Student’s t test.

