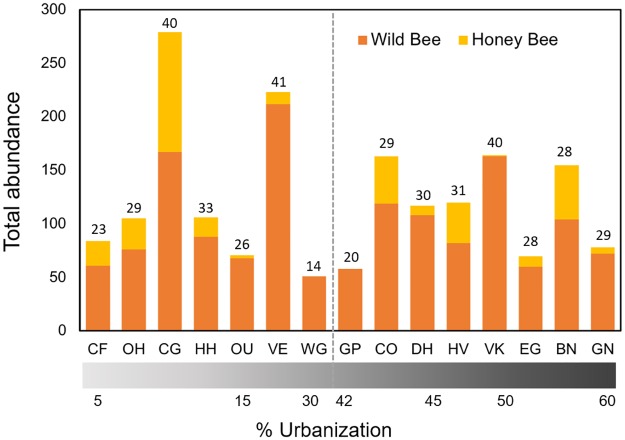
Fig 1. Bee abundance (bars) and species richness (numbers above bars) across study sites.
Sites are ordered by increasing urbanization with values for % urbanization (measured as impervious surface) shown along the bottom of the x-axis. Urbanization values are provided in S1 Table. For some analyses, sites were divided into two categories: less urbanized (mean ± SD = 13 ± 9) and more urbanized (mean ± SD = 49 ± 6). The dashed gray line illustrates how sites were divided with associated levels of urbanization.

