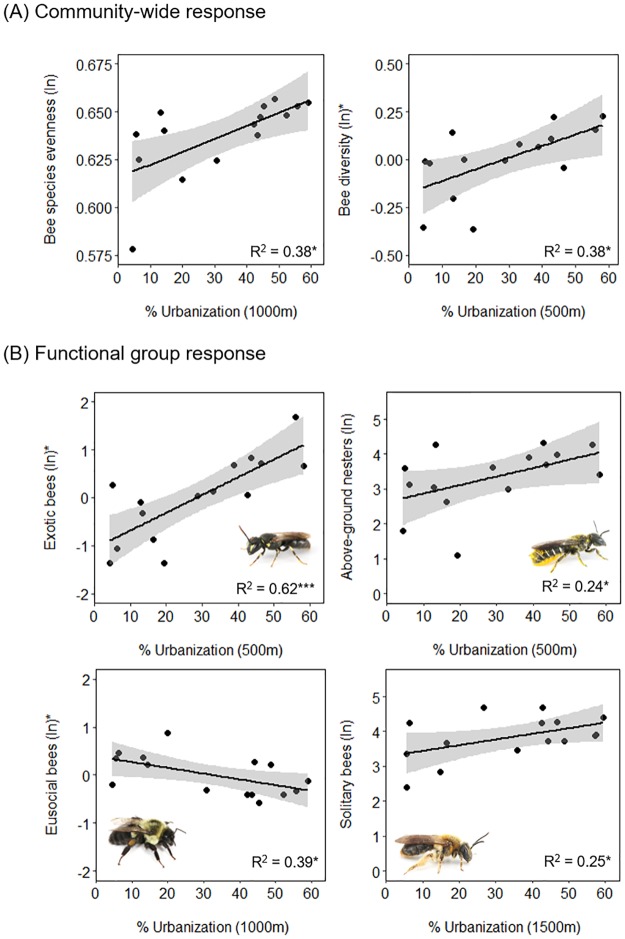
Fig 2. Relationships between wild bee response variables and urbanization predictors.
Ln(x+1) transformed data are plotted on all y-axes except those with asterisks, which indicate partial residuals are plotted instead. Partial residuals show the remaining variation explained by the plotted predictor variable when the remaining variation explained by another predictor is accounted for. Partial residuals are plotted in instances where final models had two significant predictors (Table 1). Asterisks next to R2 values indicate the significance of the plotted relationship: * P < 0.05, *** P< 0.001.

