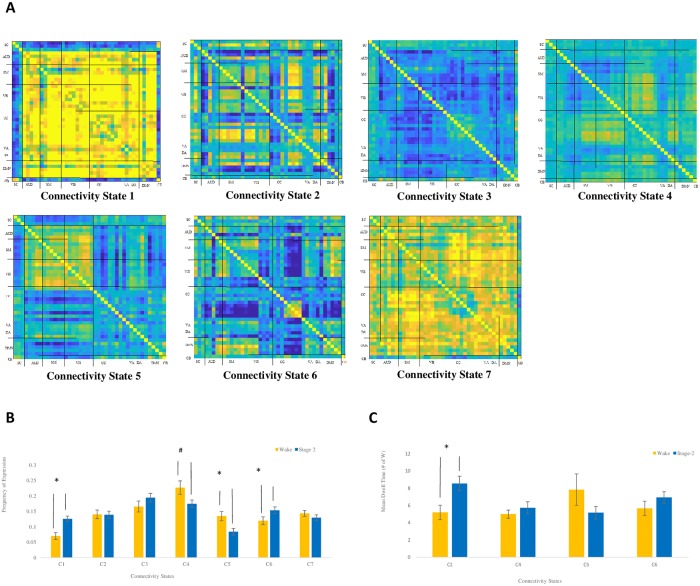
Fig 6. Cluster analysis, mean frequency, and mean dwell time.
Clustering analysis revealed 7 connectivity states in Wake and NREM2 (A). B, mean frequency of state expression in Wake (yellow) and NREM2 (blue). The frequency of connectivity state-1 and 6 were significantly greater in NREM2 (*, p < .05). The frequency of connectivity state-5 was significantly greater in Wake (*, p < .05); the frequency of connectivity state-4 expression in wake was marginally significant when compared to NREM2 (#, p = .053). C, Mean dwell time for connectivity state-1 was significantly greater in NREM2 than in Wake (*, p < .05).

