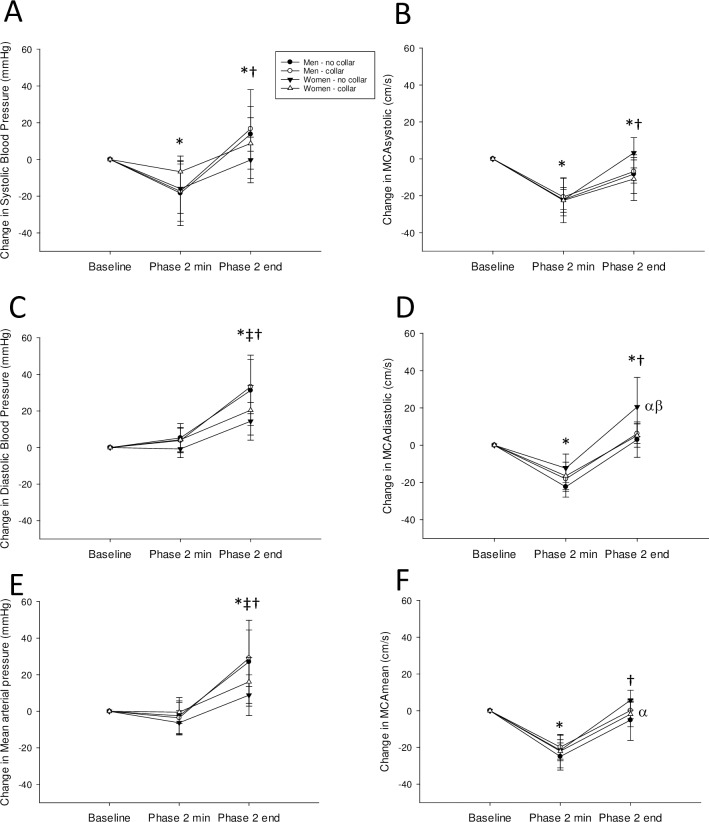
Fig 2.
Change in systolic blood pressure (A), systolic middle cerebral artery (MCA) velocity (B), diastolic blood pressure (C), diastolic MCA velocity (D), mean arterial pressure (E), and mean MCA velocity (F) from baseline, to the Phase 2 minimum during a Valsalva maneuver, and to the end of Phase 2 of the Valsalva maneuver. Men are circles, women are triangles, without the collar are black symbols, with the collar are white symbols. *indicates significant from Baseline, †indicates significant from Phase 2 min; ‡indicates a sex difference at that timepoint; α indicates a sex difference between No collar groups; β indicates a Collar effect within group; values are mean ± 95% Confidence Interval.

