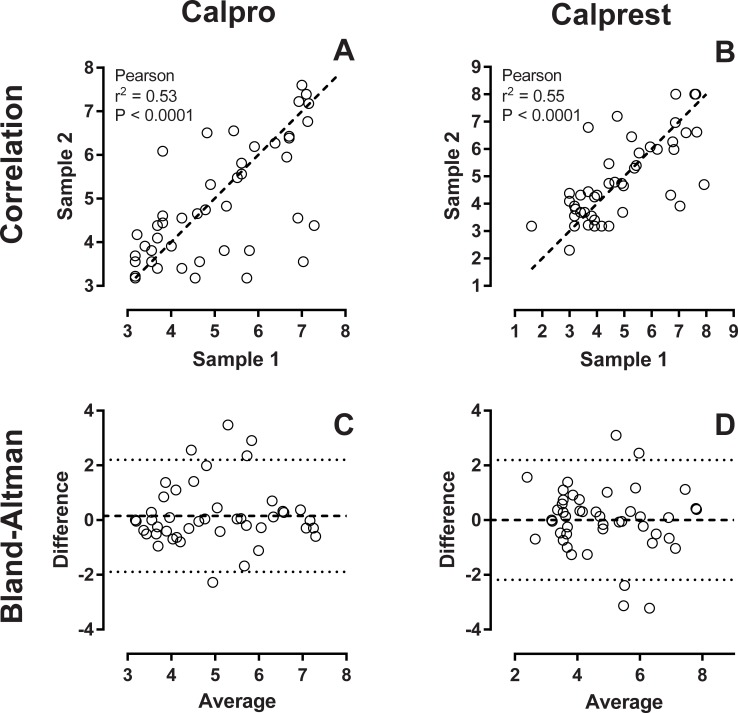
Fig 2. Day-to-day variation.
Calprotectin was measured in 51 sets of 2 fecal samples collected within 1 week from each participant. Samples were extracted and run on both calprotectin assays. Values were then ln transformed. Panels A and B show scatterplots of the two samples for both assays. Dashed line is line of identity. Panels C and D show Bland-Altman plots of the same samples.

