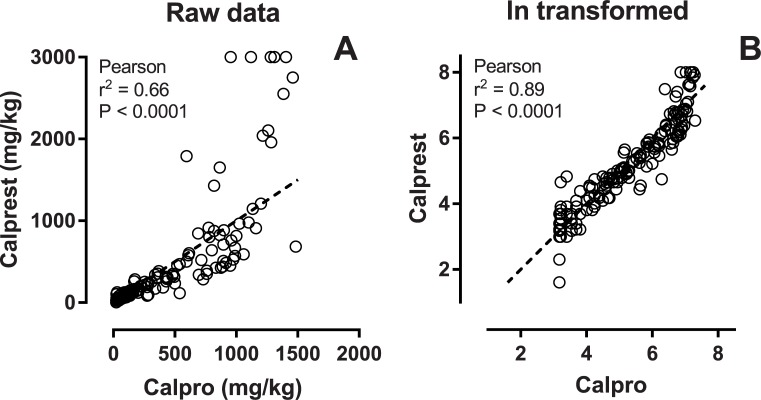
Fig 3. Method comparison.
One-hundred-eightysix samples measured with both assays. Panel A shows the raw data. Below 1000 there is a fairly linear correlation, but in the higher range the Calprest assay measures higher values than Calpro. After ln transformation of the raw data, a significant linear trend can be seen in panel B. Dashed line is line of identity.

