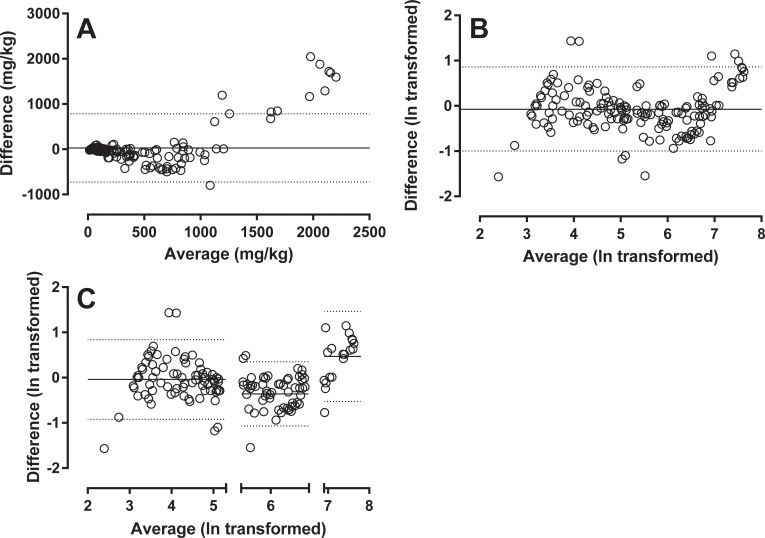
Fig 4. Bland-Altman.
Analysis of 186 samples measured with both assays. The raw data in panel A shows shifting bias along the x-axis. This tendency is confirmed in the Bland-Altman plot of ln transformed raw data in panel B. Three sections with distinct bias pattern can be defined: calprotectin values <200; values in the interval 200–1000; and values >1000. Bland-Altman plots with mean bias and limits of agreement of each of these segments are presented in panel C.

