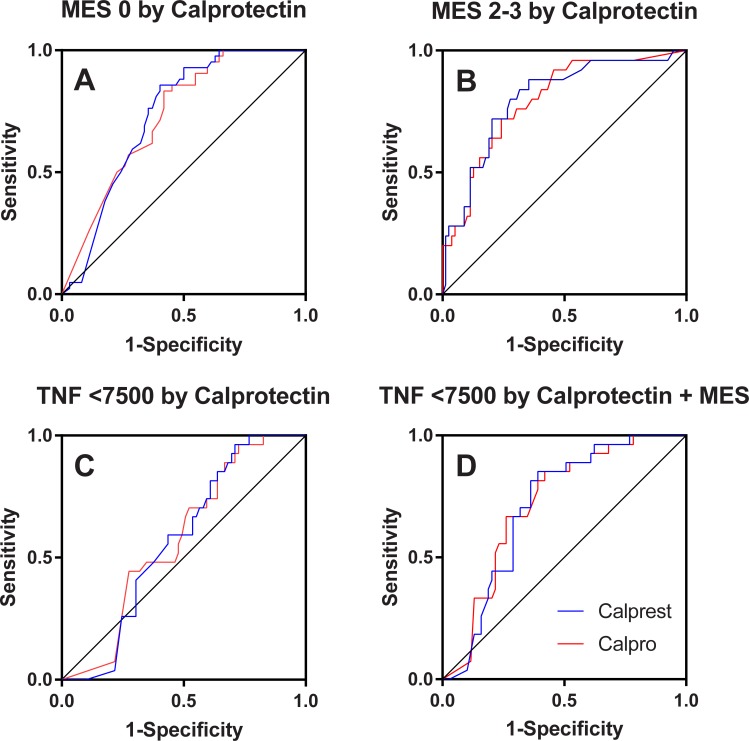
Fig 5. ROC curves.
Prediction of endoscopic inflammatory activity. Panel A: Mucosal healing defined by Mayo endoscopic subscore (MES) = 0 by calprotectin (actual state: positives 42; negatives 62). Panel B: Significant inflammatory activity defined by MES 2–3 by calprotectin (actual state: positives 25; negatives 79). Panel C: Normalized mucosal TNF gene expression (<7500 copies/ug total RNA) by calprotectin (actual state: positives 27; negatives 69). Panel D: Normalized TNF gene expression (<7500 copies/ug total RNA) by the sum of calprotectin and MES (both standardized by ln transformation and division with the maximal scale value). For all plots: blue curve for Calprest; red curve for Calpro.

