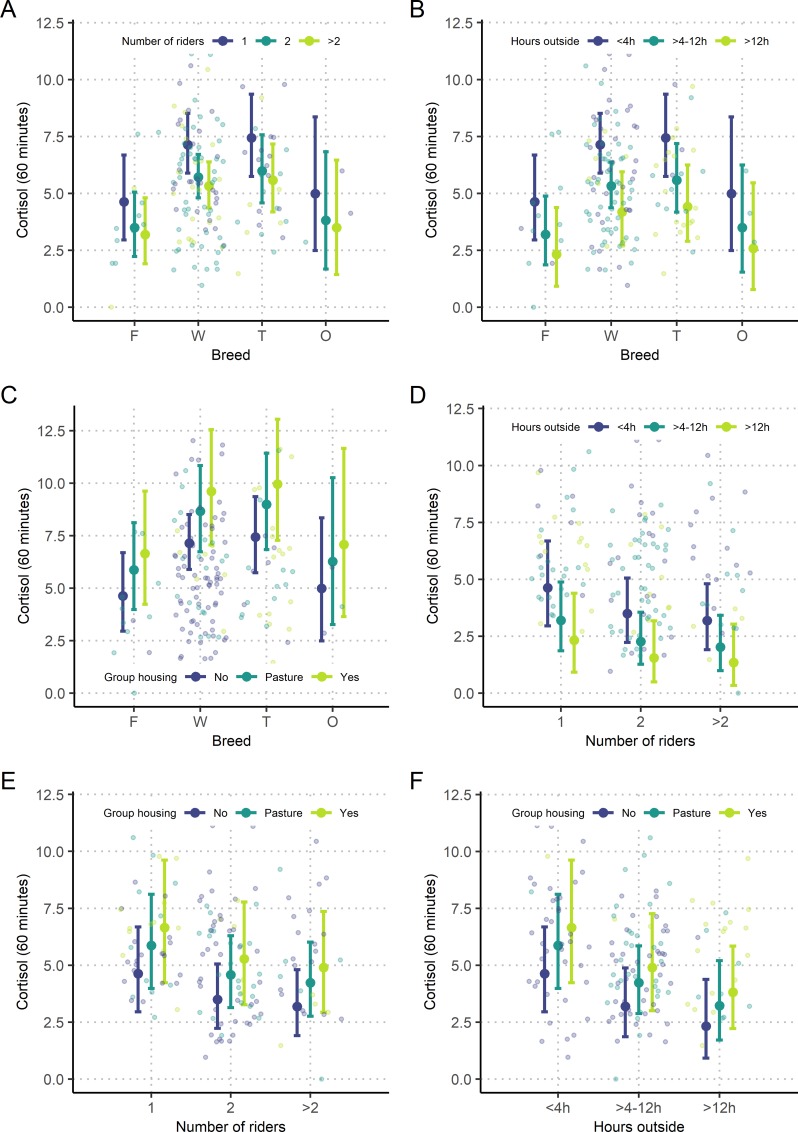
Fig 2. Predicted values of cortisol based on the linear regression model at 60 minutes after ACTH stimulation.
The explanatory categorical variables 'breed', 'number of riders', 'hours spent outside', and 'group housing' are plotted against each other for prediction of cortisol values, 60 minutes after ACTH stimulation: The six plots display predicted values of cortisol for (A) 'breed' versus 'number of riders', (B) 'breed' versus 'hours spent outside', (C) 'breed' versus 'group housing', (D) 'number of riders' versus 'hours spent outside', (E) 'number of riders' versus 'group housing' and (F) 'hours spent outside' versus 'group housing'. Open dots indicate underlying raw data.

