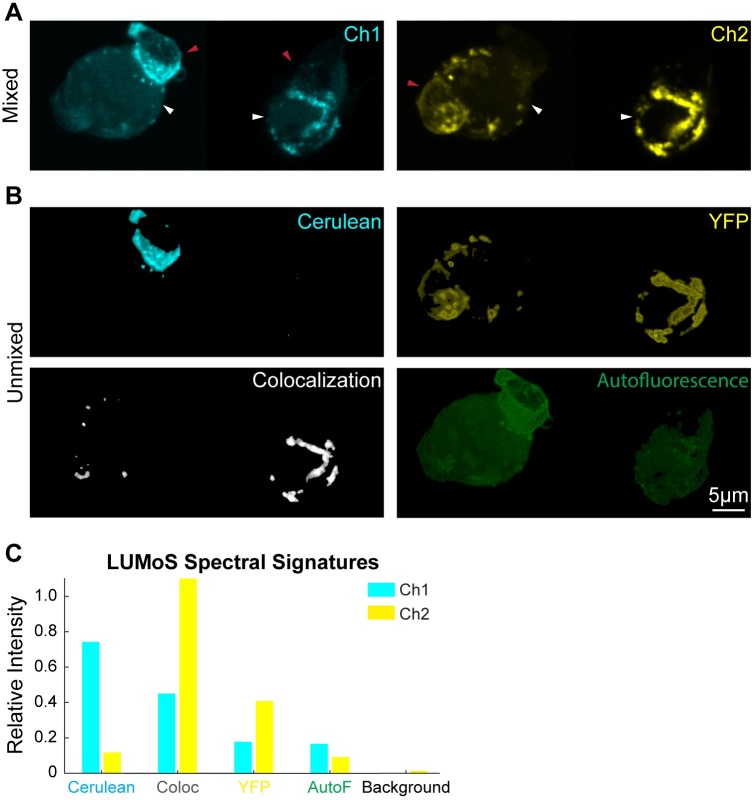
Fig 6. LUMoS unmixing for colocalization analysis and autofluorescence removal.
(A) The raw 2-channel 2PLSM images of T cells expressing Cerulean, YFP, or colocalized Cerulean and YFP. APCs are larger cells (pointed out by white arrows) than T cells (pointed out by red arrows), and APCs are non-labeled but autofluorescent. The fluorophores were concentrated at the conjugation sites between T cells and APCs. The images were z-projections of slices 6 to 17 of 3D z-stack images (S3 Movie). The left and right cells were imaged by two acquisitions and stitched, but with the same imaging conditions. (B) LUMoS separation results of the images in A. Autofluorescence and colocalization were split into separate channels while keeping pure Cerulean and YFP signals in their own channels. Signals from background pixels were separated and removed (S3D Fig). (C) The spectral signatures of each structures produced by LUMoS. Background and autofluorescence (AutoF) were identified as additional pixel groups with distinct signatures. Colocalization (Coloc) spots were separated out due to its different spectral signature from the Cerulean-only and YFP-only groups.

