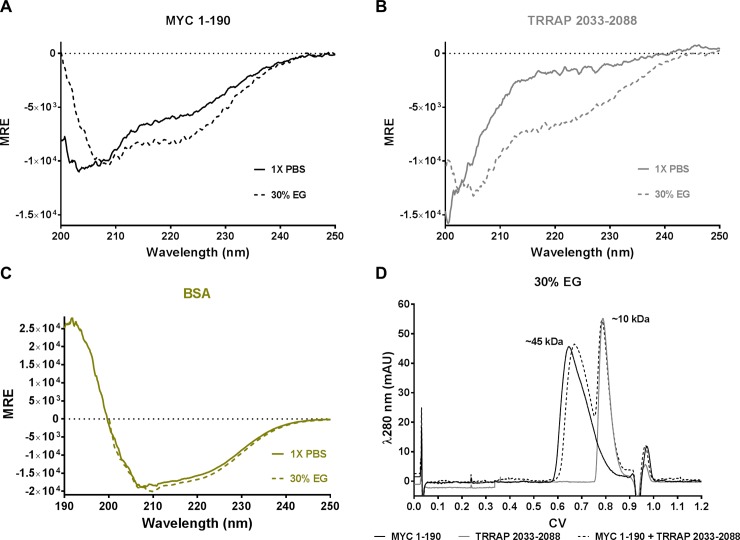
Fig 3. Effects of ethylene glycol on MYC and TRRAP.
(A-C) CD spectra of MYC 1–190, TRRAP 2033–2088, and BSA. Solid lines represent measurements taken in 1X PBS; dotted lines represent measurements taken in 30% EG. A significant increase in the α-helical character of MYC and (to a lesser extent) TRRAP is observed in the presence of EG. However, BSA (a highly α-helical well-folded protein) appears unaffected by the presence of EG. D) SEC λ280 spectra of MYC 1–190 (black), TRRAP 2033–2088 (grey), and MYC 1–190 mixed with TRRAP 2033–2088 (black dotted) in 30% EG all at 100 μM. Neither MYC nor TRRAP showed any variation in their expected hydrodynamic radius as measured in 1X PBS. The mixed sample did not have any measurable tertiary peak that would indicate an association between the MYC and TRRAP.

