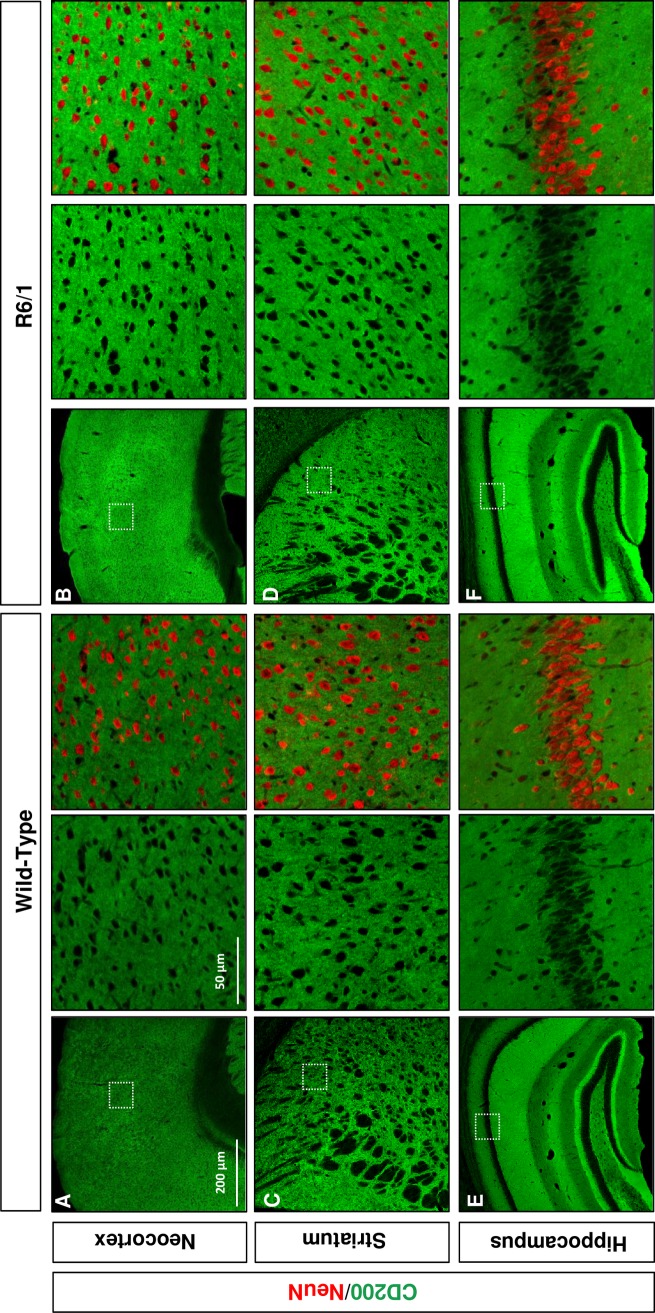
Fig 2. CD200 is increased in R6/1 brain parenchyma.
Immunohistochemical comparative analysis of CD200 in wild-type versus R6/1 mouse (A, B) neocortex, (C, D) striatum, and (E, F) hippocampus. Immunolabeling of CD200 is shown in green in representative microphotographs of cryoprotected coronal sections from 20-week-old wild-type and R6/1 mice. Colocalization with NeuN immunolabeling (red) is shown within high magnifications insets for each brain region and genotype. Scale bars = 200 μm and 50 μm. The images shown are representative of four different experiments.

