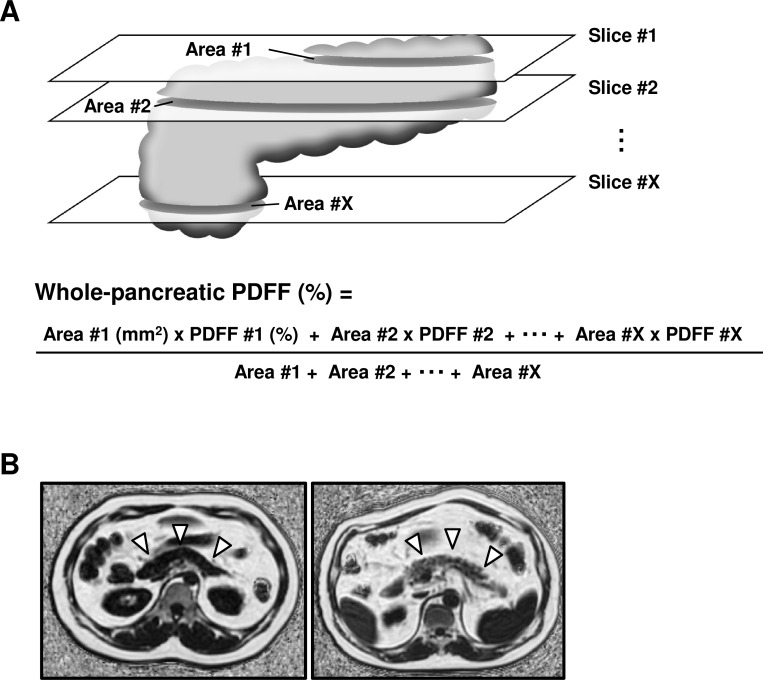
Fig 1. The schema of whole-pancreatic analysis and representative fat-water MRI images of low or high degree of pancreatic steatosis.
(A) The schema of whole-pancreatic analysis is shown. (B) Representative pancreatic images of fat-water MRI are shown. A white arrow indicates the pancreas. The left panel shows the low degree of pancreatic steatosis in a sample whose whole-pancreatic FF value was determined to be 1.20%. The right panel shows the high degree of pancreatic steatosis in a sample whose whole-pancreatic FF value was determined to be 34.87%.

