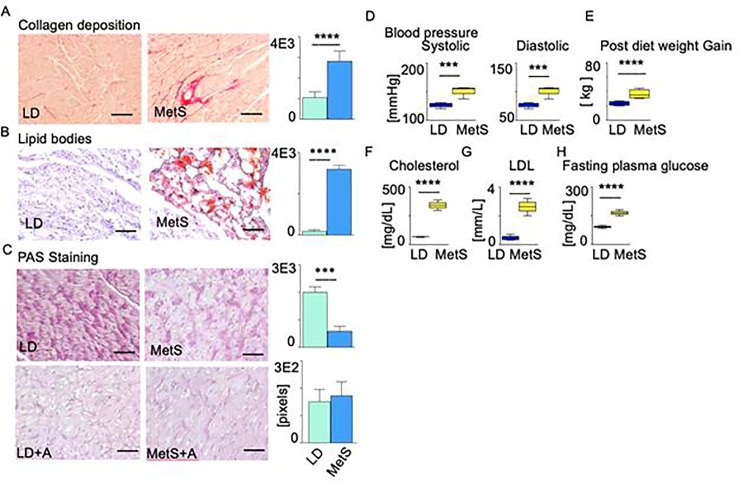
Fig 1. Impact of diet on metabolic syndrome risk factors in swine.
MetS and LD swine are histologically compared by using paraffin embedded or cryo-preserved myocardial left ventricular tissue. Data are represented as means ± SD (n = 4 MetS, n = 4 LD). Representative images of myocardial tissue are shown at x20 high-power field, **p<0.01, ***p<0.001, ****p<0.0001 by Mann-Whitney U test. Scale bars: 20 μm (A, B, C). (A) Collagen deposition was evaluated by picrosirius red staining. The bar diagram on the right presents collagen staining (red) intensity in pixels. (B) Lipid oil red O staining for neutral triglycerides and lipids accumulation in frozen tissue sections. The bars diagram on the right presents the positive (red) staining intensity in the MetS (n = 6) and LD tissues (n = 6) in pixels (p = 0.0001). C) LD and MetS tissue sections are stained with PAS. LD tissue sections are treated with Amylase before PAS staining (LD+A, MetS+A panel). The difference in the PAS staining intensity before and after amylase treatment is used to calculate the glycogen content. The bar diagrams presents glycogen deposition (relative units) in the MetS and LD tissues (p = 0.001). (D) Systolic and diastolic blood pressure [mmHg] in MetS and LD pigs one week before surgery (n = 6 MetS and n = 6 LD, p = 0.0001). (E), Post diets weigh gain in kg for LD and MetS (n = 6 MetS and n = 6 LD, p = 0.0001), (F) cholesterol (n = 6 MetS and n = 6 LD, p = 0.0001), (G) plasma LDL (n = 6 MetS and n = 6 LD, p = 0.0001), (H) fasting plasma glucose (n = 6 MetS and n = 6 LD, p = 0.0001). Data represent mean± SD. ***p<0.001, 2-tailed Student’s t test.

