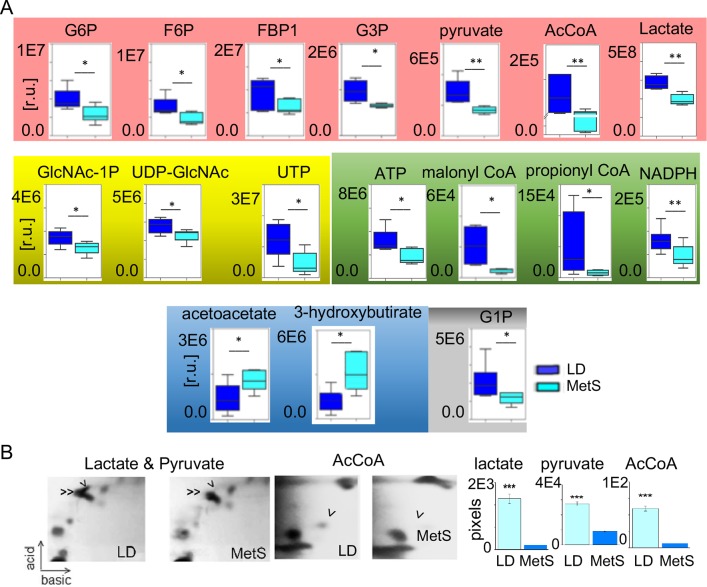
Fig 3. Key metabolic changes in the MetS heart.
(A) LC/MS-MS data reveal significant alterations in content of metabolites in MetS vs. LD. The LC/MS-MS data are equalized based on protein content. GAPDH is used as an internal loading standard as well. The barrel diagrams show the individual metabolites content (relative units, r.u.) in LD (n = 6) and in MetS (n = 6). The identity of the metabolites is shown at the top of the diagrams. The metabolites that are related to glycolysis are highlighted in pink, hexosamine biosynthetic pathway in yellow, fatty acid oxidation related metabolites in green, ketone body family in blue, and glycogenolysis product in gray. Values are means ± SD. G6P, UTP (p = 0.01); acetyl-CoA (p = 0.006); NADPH (p = 0.009); F6P, FBP1, G3P, ATP, malonyl-CoA, acetoacetate, GlcNAc-1P (p = 0.02); pyruvate (0.004); 3-hydroxybutirate, G1P (p = 0.03); propionyl-CoA (0.05); lactate (p = 0.005). *p<0.05, **p<0.01, 2-tailed Student’s t-test. (B) 2d TLC separation of lactate and pyruvate in LD and MetS tissue: single arrow—lactate position, double arrow–pyruvate, AcCoA -single arrow. The bar diagram on the right shows the spot intensity (pixels) after background correction representing the average value of three independent extracts, each from 20 mg of tissue: MetS (n = 3), LD (n = 3). Data are presented as means ±SD. ***p<0.001, 2-tailed Student’s t-test.

