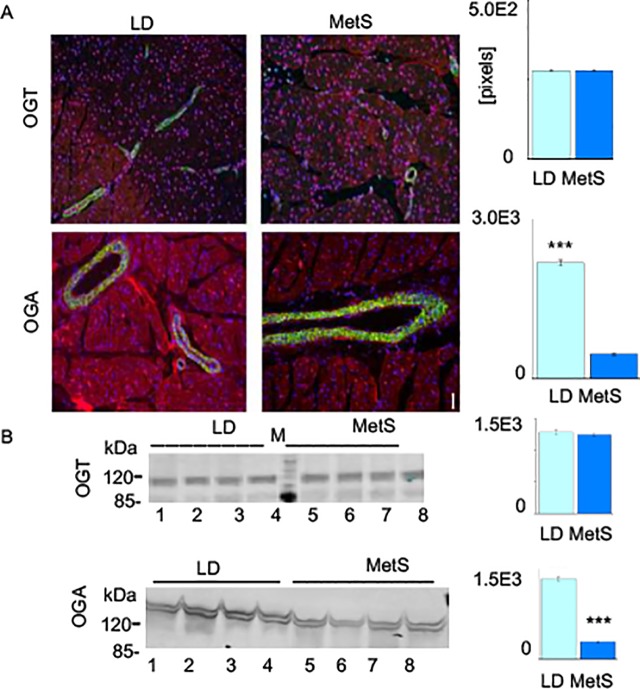
Fig 6. OGT and OGA content in LD and MetS cardiac tissues.
(A) Immunofluorescence showing differences in OGA content (red) in LD and MetS tissue while their OGT content (red) is nearly identical: green shows smooth muscle alpha actin antibody and blue shows the nuclear DNA. The intensity of the red staining in a surface with equal number of nuclei was measured with NIH ImageJ 1.31 and the bar diagram at the right presents the average OGT and OGA staining value of tissue sections from MetS pigs presented as relative pixels (n = 4, ***p<0.001). (B) Western blot showing amount of OGT and OGA in tissue lysates (50 μg protein/lane) from four representative LD pigs (line 1, 2, 3, 4) and four MetS pigs (lines 5, 6, 7, 8). The bars on right present pixel density of OGA and OGT in MetS lysates vs. LD and determined by ImageJ 1.31 and are shown as mean ± SD (n = 4, ***p<0.001). The p values were calculated by Studentʼs t-test. See also Supporting information S2 Fig.

