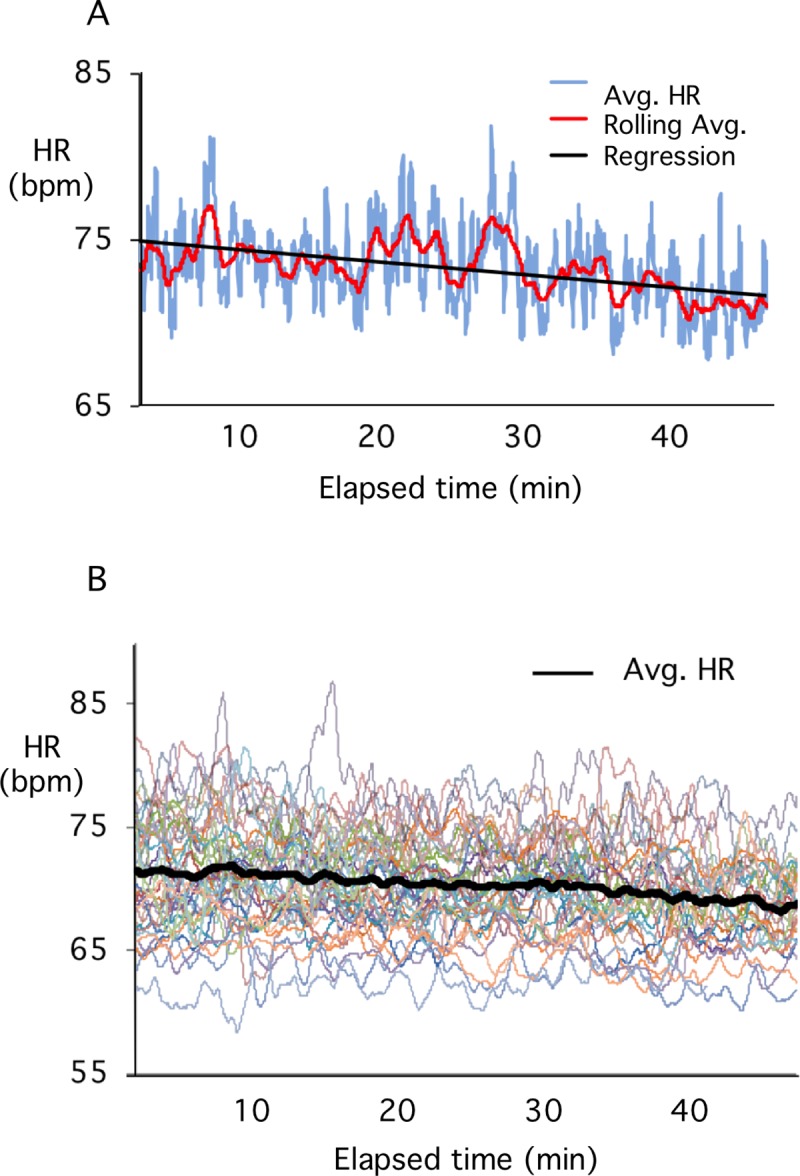
Fig 1.

A). Average (blue) and rolling average of HR (red) for a total of 10 students over approximately 48 minutes of a lecture class. The first and last 3 minutes of the class were removed from the analysis (see text). The regression line for the HR over the duration of the class is shown in black. B). Average of HR activity (solid black line) for a total of 42 lecture classes (individual colored lines). Data includes class averages from 310 student traces at one second intervals. Note the steady decrease in HR between the beginning and end of the lecture period.
