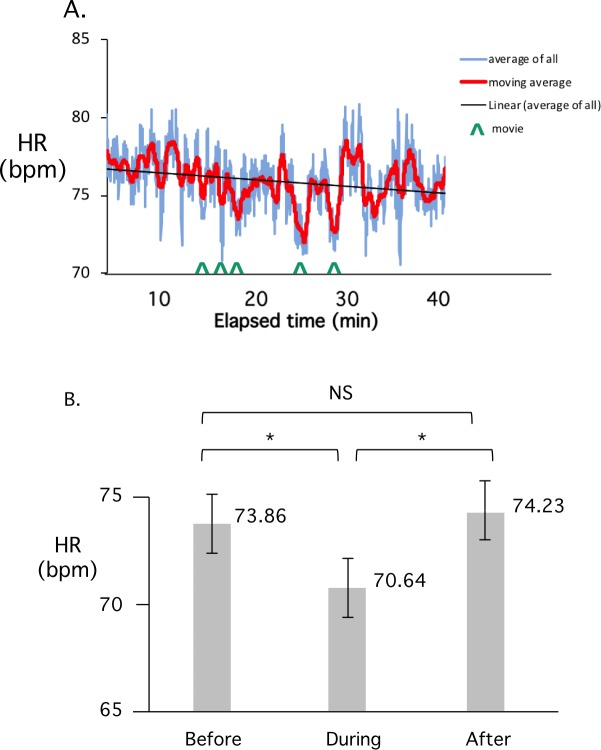
Fig 5. HR decreases during movies and returns to pre-movie levels afterwards.
A). Average student HR during a lecture class containing 5 distinct short videos, indicated by vertical arrows. The beginning of each video corresponds to a rapid drop in HR. B). Peak to trough analysis of the HR before, during and after the video presentations. A total of 10 videos were analyzed. The decrease in HR during the movie is statistically significant (Paired T-test, * P < 0.05).

