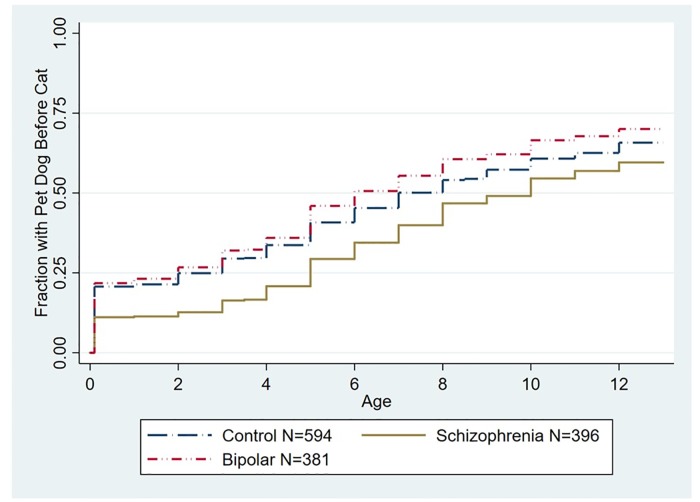
Fig 2. Kaplan Meier plot depicting accumulated proportion of exposure to first household pet dog stratified by diagnostic group censored for prior exposure to a household pet cat.
The age distribution of the censored population is shown in S1 Table. The group of individuals with a schizophrenia diagnosis differed from the control group (HR .76, 95% CI .63 -.91, p < .002 adjusted for age, gender, race/ethnicity, parental education, and place of birth). The group of individuals with bipolar disorder did not differ significantly from the control group. The numbers shown indicate the total population including those who were censored.

