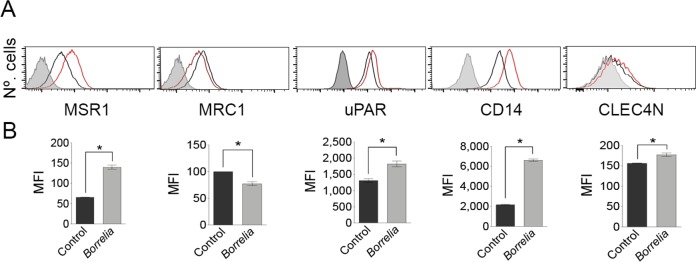
Fig 2. Validation of the transcriptomic analysis of BMM receptors involved in the response to B. burgdorferi.
(A) Flow cytometry analysis of receptors after 16 h stimulation with B. burgdorferi (red histogram / grey bar) or non-treated controls (black histogram / black bar). The gray histogram represents the 4°C control. (B) Histograms showing the mean fluorescence intensity (MFI) of BMM stimulated with B. burgdorferi and controls. The data shown represent the average ± SE of BMM from 3 mice.

