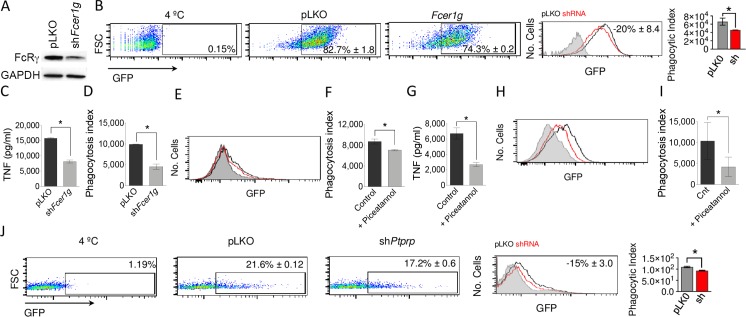
Fig 6. The common gamma chain, Syk kinase and SHIP1 phosphatase are mediators of B. burgdorferi phagocytosis.
(A) Downregulation of FcγR expression in RAW 264.7 cells infected with lentivirus containing shFcer1g or the empty vector, as determined by immunoblot analysis. (B) Phagocytosis of B. burgdorferi by shFcer1g RAW 264.7 cells. (C) TNF production by shFcer1g RAW264.7 (grey bar) or pLKO.1 controls (black bar) upon stimulation with B. burgdorferi. The data represent the average ± SE of 3 experiments. (D) Phagocytosis of B. burgdorferi by shFcerig BMMs (grey bar) or controls (pLKO.1 infected, black), analyzed as in Fig 5B. The data represent the average ± SE of 3 mice. (E) Phagocytosis of B. burgdorferi by BMMs treated with Piceatannol (red histogram) or non-treated controls (black histogram). The gray histogram represents the 4°C control. (F) Phagocytosis index of BMMs treated with piceatannol (grey bar) or non-treated controls (black bar). The data represent the average ± SE of 3 mice. (G) TNF production of piceatannol treated BMMs in response to B. burgdorferi stimulation (grey bar) and controls (black bar). The average ± SE of 3 mice per group is presented. (H) Phagocytosis of B. burgdorferi by hMACs treated with Piceatannol (red histogram) and controls (black histogram). The gray histogram represents the 4°C control. (I) Phagocytosis index of hMACs treated with Piceatannol (grey bar) and controls (black bar). The data represent the average ± SE of 5 donors. (J) Phagocytosis of B. burgdorferi by shPtprc RAW 264.7 cells. The data were analyzed as in Fig 5B and represent the average ± SE of 3 experiments.

