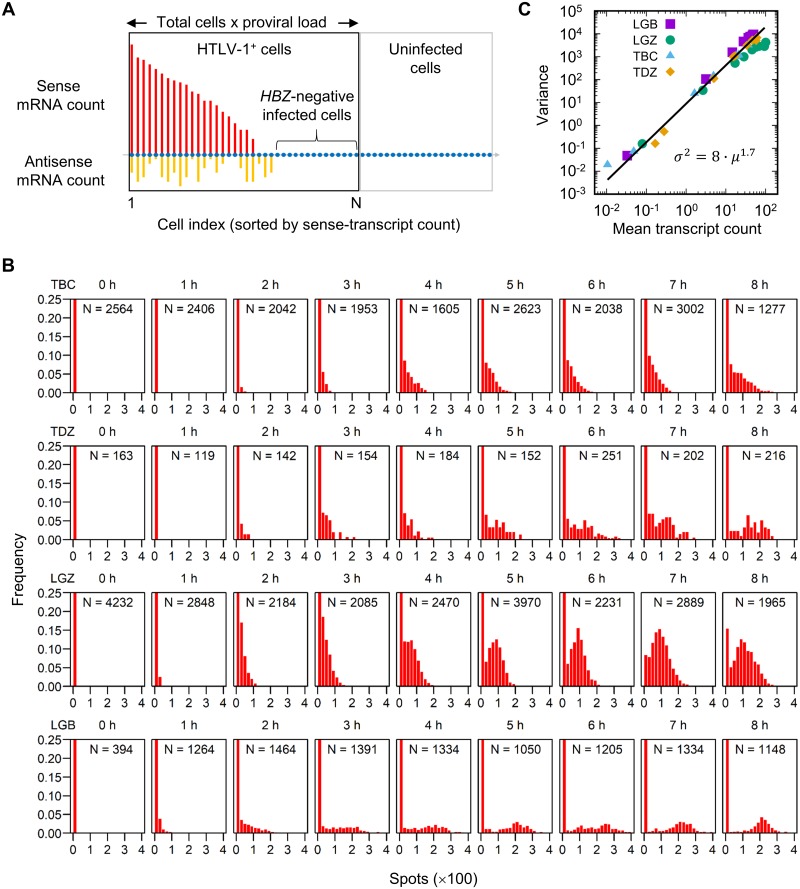
Fig 2. Sense transcript count per HTLV-1+ cell: Progression over time.
(A) Schematic diagram of the identification of the HTLV-1+ population for analysis. The entire population (in the black and grey rectangles) are the cells identified and analyzed by microscopy. The size of the HTLV-1-infected population (black rectangle) was estimated by multiplying the total cell count by the proviral load as measured by ddPCR. Also see Materials and methods. (B) Sense-transcript count per HTLV-1+ cell (bin size = 20, note the units) at each time point for the two patients with HAM (TBC and TDZ) and two with ATL (LGZ and LGB). Note that the first few bins in each case are out of scale on the y-axis. In the inset for each histogram is indicated the number of cells analyzed. (C) The mean and variance of the sense transcript count per HTLV-1+ cell obtained from four patients, each containing nine time points.

