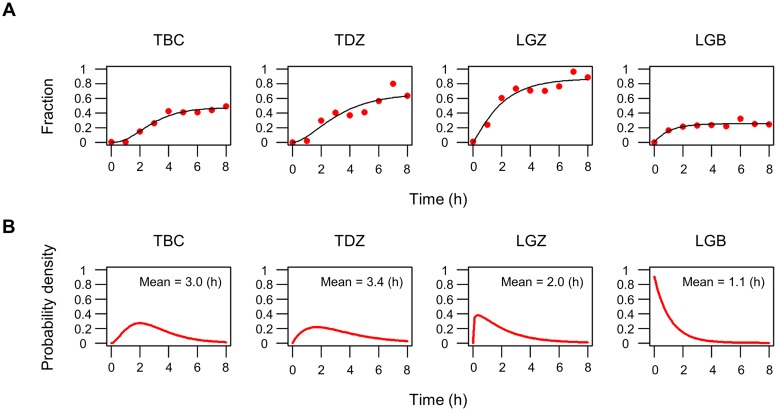
Fig 3. Rate of onset of HTLV-1 reactivation.
(A) Increase in the fraction of cells that carry ≥3 sense transcripts over time (red dots). The black line for each HTLV-1+ subject indicates a fitted curve with a cumulative gamma distribution. (B) Probability density of the gamma distribution obtained from panel A for each HTLV-1+ subject. The inset numbers indicate the mean time of the onset of reactivation after the start of ex vivo culture.

