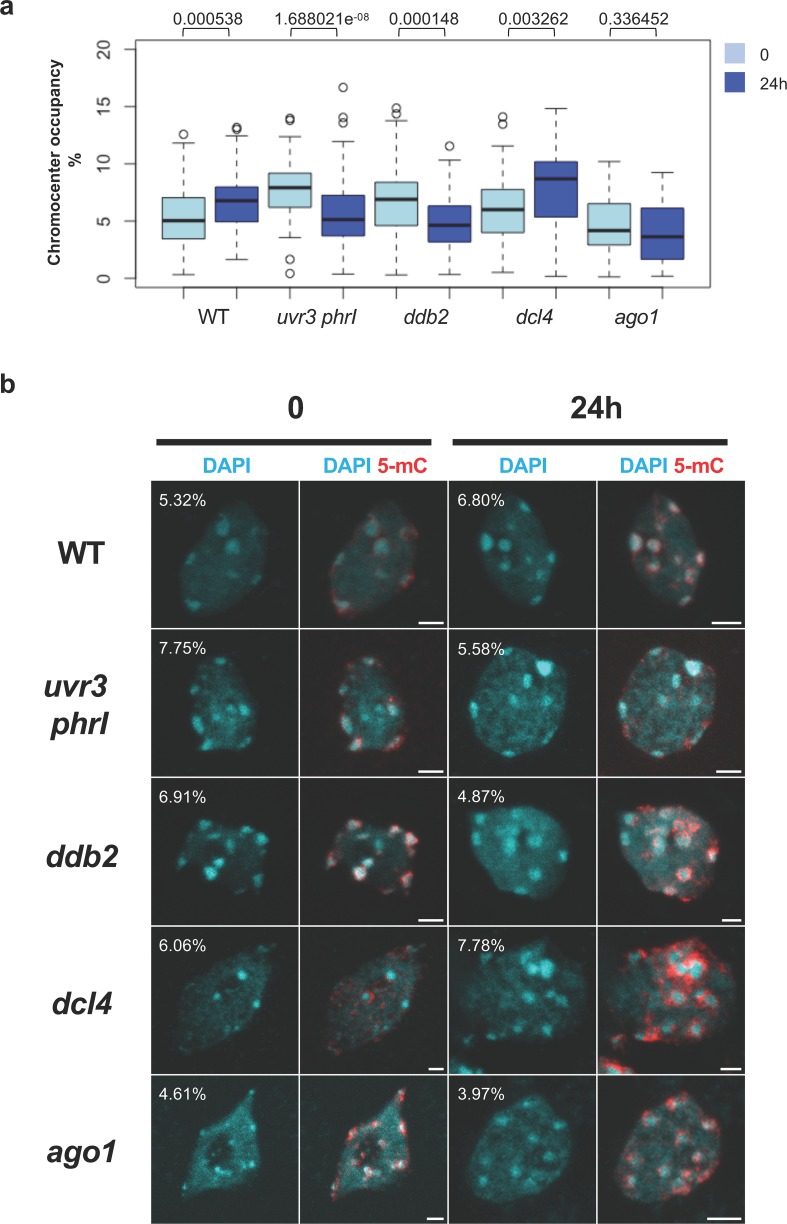
Fig 2. Chromocenters and 5-mC phenotypes upon UV-C exposure.
a Boxplots representing the percentage of Chromocenters Occupancy (CO) in WT, uvr3 phrI, ddb2, dcl4 and ago1 plants before (0) and 24h upon UV-C exposure. CO was determined using DAPI staining, confocal microscopy and measured with an automated image quantification program. Exact p values according Mann Whitney test are indicated above each graph. Number of nuclei analyzed: 44 to 109. b Chromocenters phenotypes of isolated leaf nuclei of WT, uvr3 phrI, ddb2, dcl4 and ago1 plants before (0) and 24h upon UV-C exposure. Representative DAPI staining (cyan) and 5-mC immunostaining (red) are shown for each genotype and time point. CO are indicated on the representative picture for each genotype and time point. Images were reconstructed from confocal image stacks. Scale bars = 2 μm.

