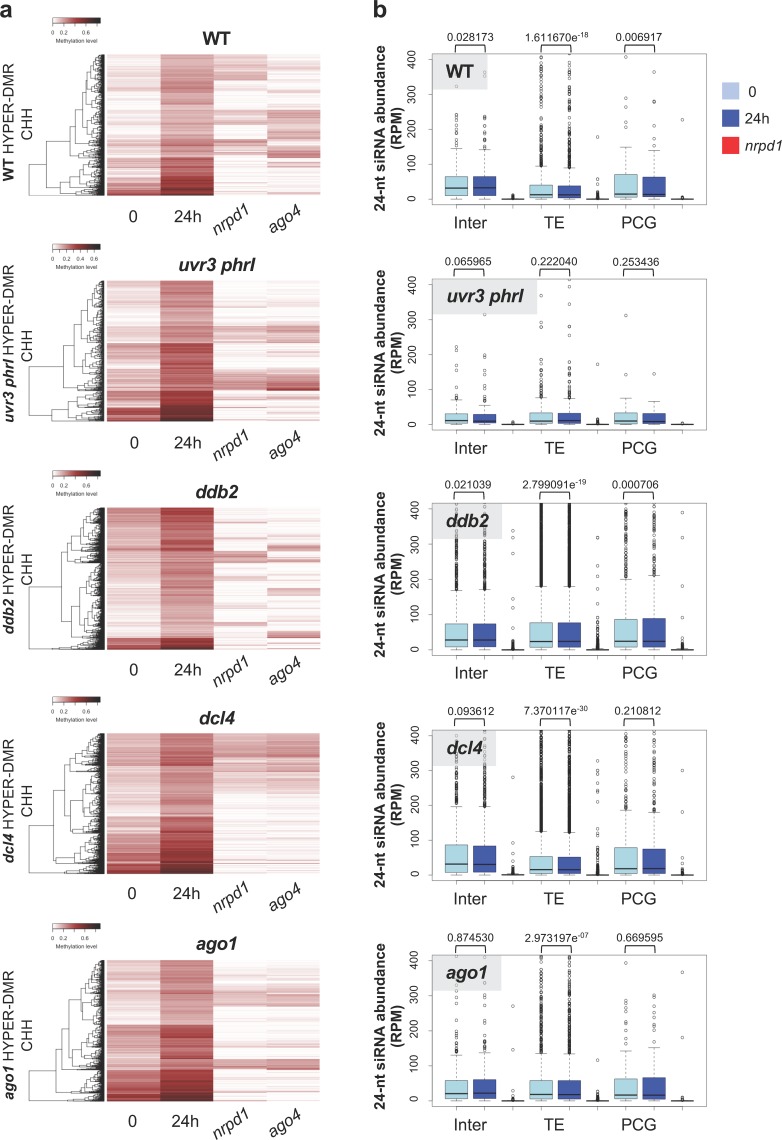
Fig 4. RNA-directed DNA methylation and DMRs.
a Heatmaps of CHH methylation levels within hyper-DMRs identified in WT, uvr3 phrI, ddb2, dcl4 and ago1 plants before, 24h upon UV-C exposure. The CHH methylation levels of each of these hyper-DMR are reported for RNA POL IV (nrpd1) and AGO4 (ago4) deficient plants. Columns represent data for each indicated genotype (white: 0; black: 1). b Boxplots representing the abundance of 24-nt siRNAs mapping to the CHH hyper-DMRs identified in WT, uvr3 phrI, ddb2, dcl4, ago1 and plants. For each genotype the abundance of 24-nt siRNAs is shown in RNA POL IV deficient plants (nrpd1). The 24-nt siRNA abundance is normalized against global small RNA content and expressed as reads per million (RPM). p-values are calculated according to Wilcoxon Matched-Pairs Signed-Ranks.

